BioCycle August 2004, Vol. 45, No. 8, p. 54
A case study of the King County, Washington biosolids program provides tools to evaluate the CO2 emissions and carbon sequestration of various management options. Part I
Sally Brown and Peggy Leonard
GLOBAL warming is one of, if not the greatest, environmental threat currently facing our society. Global warming is thought to be caused by elevated emissions of gases that trap heat in the atmosphere. In 1997, 160 of the world’s developed nations met and adopted the Kyoto Protocol in an attempt to reduce emissions of greenhouse gas responsible for global warming. Although the United States has not signed the protocol, local agencies and private companies have begun to understand the impact of their daily operations on the carbon balance and global warming. A bill, the McCain-Lieberman Climate Stewardship Act, will soon be introduced in the Senate to begin concrete actions in the U.S. to control global warming.
King County, Washington prides itself on being an environmental steward. As such, it has taken steps to understand how its various programs impact global warming. As part of this goal, King County asked the University of Washington to conduct a carbon accounting of its current biosolids management program. Carbon accounting measures the amount of greenhouse gases released or stored as a result of our activities. The accounting is done in terms of tons of carbon or tons of carbon dioxide gas (see sidebar). Included was an evaluation of the impact of a range of both disposal and end use options for biosolids on global warming. The results from this process were encouraging. It seems as though appropriate management of a biosolids program is one way that a municipality can accrue carbon credits and reduce the impact that their operations have on the environment. The Washington State Department of Ecology advocates responsible beneficial reuse of biosolids, but may allow landfilling on a temporary or emergency basis. This makes the findings of the King County carbon accounting even more significant.
Employing carbon accounting to understand the impact of King County’s biosolids program on CO2 emissions and carbon sequestration is a complicated process. Of the many possible approaches, the most straight-forward involves a strict accounting of the fertilizer value of the biosolids and the CO2 gained or lost by using biosolids in lieu of commercial fertilizers. However, this approach does not consider land use, impact of biosolids on soil carbon, C accounting for other disposal or beneficial use options, or what types of crops are grown on biosolids fertilized soils. In other words, the potential to maximize carbon sequestration using biosolids as a tool is not captured by this approach. For that reason, we will attempt to describe the potential impact of different biosolids use or disposal options on carbon accounting for the County. Keep in mind that carbon accounting is not a precise science. There is often disagreement on how particular practices affect carbon balances. In addition, the range of factors that must be considered for the accounting to be truly accurate is large and complex. Because of these factors, there may be flaws in this description.
CAUSES OF GLOBAL WARMING
To best understand how biosolids can relate to global warming, a basic summary of what is known about global warming is necessary. Global warming results when gases in the atmosphere are able to retain heat that is radiated from the surface of the earth as infrared light. The light is absorbed as energy and gradually released. The atmosphere consists primarily of oxygen and nitrogen gas. Both of these gases are incapable of absorbing this heat energy and so are not involved in the warming process. However, other gases such as CO2 are able to absorb this heat energy and reradiate it back in all directions. The end result is this energy does not leave the earth’s atmosphere. A large portion remains in the lower region of the atmosphere, making it warmer. In addition, less reaches the upper portion of the atmosphere, leaving it cooler. Some gases are more efficient at absorption than others. These pose more of a threat to global warming than CO2. Methane is a case in point. One molecule of methane (CH4) is 23 times more effective at absorbing heat and therefore 23 times more of a concern than one molecule of CO2. Table 1 provides characteristics of three primary greenhouse gases – carbon dioxide, methane and nitrous oxide (N2O) – including their pre- and post-industrial atmospheric concentrations, persistence time in the atmosphere, and their CO2 equivalence.
Carbon dioxide is produced naturally through aerobic respiration. All creatures that use carbon as a food source and breathe will release CO2. Atmospheric CO2 is consumed naturally through photosynthesis. All fixed carbon on earth was initially derived from plants using energy from the sun to reduce carbon from the atmosphere. There are two carbon cycles. The rapid cycle involves atmospheric carbon that is fixed by plants and returned to the atmosphere after the plant material is eaten. Biosolids fit into this cycle. The long-term cycle involves release of carbon deposits from the earth into the atmosphere. Examples include burning of fossil fuels and deforestation.
Methane (CH4) is generated naturally as well as anthropogenically. Wetlands are the primary natural source of methane, producing 120 to 175 Tg CH4 per year. Natural sources of methane are generally not included in global warming calculations. Anthropogenic emissions originate from rice paddies, natural gas drilling and transmission, coal mining, enteric fermentation, manure, and solid waste disposal. These sources of methane are taken into account for global warming calculations.
Finally, nitrous oxide (N20) is produced microbially in both the denitrification and nitrification portions of the N-cycle. It also is produced by nitrogen fertilizer use, which adds to the pool of nitrogen that is subject to nitrification and denitrification reactions. Animal waste, as it also contains N, also contributes to the generation of atmospheric N2O.
KYOTO PROTOCOL
The most significant policy step to control emissions of these gases was codified in the Kyoto protocol. While this pact has set the standard internationally, it has not been officially adopted in the U.S. Despite that fact, it is used as a guide for controlling CO2 emissions. The Kyoto protocol lists policies or practices that can contribute to the reduction of greenhouse gas emissions. Those potentially pertinent to biosolids advocate energy efficiency, protection and enhancement of sinks and reservoirs of greenhouse gases, reforestation, sustainable forest management and agriculture, development and use of new and renewable forms of energy, reducing transport-based emissions and reduction of methane emissions through recovery and use in waste management.
To date, our understanding of the factors involved in global warming is very limited. This is a highly complex field and a wide range of sources of greenhouse gases as well as natural fluctuations have to be taken into account to fully understand what is happening in the atmosphere. In addition, we are uncertain about what effects global warming will have both in the near and long term. What is generally agreed upon is that the earth is getting warmer and that this is at least partially the result of what us humans are doing here on the earth’s surface. It is also generally agreed that this is not a good thing, with views on the consequences ranging from manageable to catastrophic. As a consequence of what we know, the vast majority of the developed nations are attempting to identify ways to reduce emissions of greenhouse gases. It is likely in the near future that carbon credits, accruing from reduced emissions or increased sequestration, will be assigned a monetary value. Industries and countries will start trading sequestered carbon. Municipalities will evaluate how their programs increase or decrease carbon emissions. And biosolids can play a role in the carbon balance.
BIOSOLIDS AND THE CARBON BALANCE
The carbon present in municipal wastewater treatment and released into the atmosphere as CO2 is not considered to be a portion of the greenhouse gases responsible for global warming. This carbon represents the breakdown of recently fixed C and is considered to be part of the biological or rapid carbon cycle. For example, a corn plant fixes CO2 as it grows and by doing so, sequesters carbon. However, shortly after that carbon is fixed, the corn plant gets eaten and the fixed C is released by a person or a cow as CO2, reentering the atmosphere. Greenhouse gases other than CO2, including CH4 or N2O, are factored in the balance as they are not considered to be part of the biological carbon cycle. In addition, fossil fuels used in treating wastewater or managing biosolids can be considered. However, biosolids have the potential to be a source of energy or carbon credits by providing an alternative to practices that make use of carbon reserves such as fossil fuels used in manufacturing commercial fertilizers.
Processing biosolids can either work to consume energy (drying and aerobic digestion), or as a source of energy (anaerobic digestion with methane collection). Biosolids can be landfilled to increase carbon reserves. However, landfilled biosolids will decompose under anaerobic conditions and generate methane. Unless methane is efficiently harvested, this can have a net negative result on CO2 balances. Biosolids have value as fertilizer. By using biosolids, synthesis of commercial fertilizers and associated energy use is avoided. There are transportation costs associated with use of biosolids as fertilizer, which have the potential to take away from credits gained. Biosolids are used to fertilize a range of crops. For many crops, their lifecycle (as a fertilizer) is short enough that they are not considered in the C balance. However, for forestry and potentially for restoration sites, there is the potential to generate C credits for biosolids application. Biosolids also can be used to grow bioenergy crops, which can generate C credits for the fossil fuel use avoided. Finally, biosolids can also be used to increase total soil C, a major sink for carbon.
The range of different options for biosolids and the potential impact of these options on greenhouse gas emissions are evaluated below. A comparative carbon accounting of the current King County biosolids program is included – without considering the micronutrient value of biosolids or the benefit of building soil carbon reserves. Part II takes those factors into account, assessing the impact on CO2 mitigation.
ENERGY COSTS OF LANDFILLING BIOSOLIDS
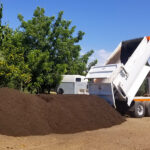
Solids from a wastewater treatment facility can be landfilled either prior to, or after, digestion and stabilization. In either case, there is a high potential that methane will be generated as a result of anaerobic decomposition of wastewater BOD. The rate and amount of methane generated will depend on a number of factors. Lab studies have evaluated methane generation from components of municipal solid waste (Eleazer et al., 1997). In this study, grass produced about half as much CH4/g as the food waste. Over 80 percent of each material had decomposed by the end of the study. The actual decomposition rates of materials in a landfill will vary based on several factors including moisture content, nutrient status, pH, and temperature (Hilger and Barlaz, 2003). If wetter conditions persist, more methane will be produced. However acid pH and high nitrogen content will decrease rates of methane production.
Methane formed from the decomposition of landfilled materials can do one of three things: Stay under the cap in the landfill; Escape into the atmosphere; or Be harvested for flaming or biogas capture and use. These three alternatives are not mutually exclusive and the relative balance between the three will determine the net carbon balance associated with this disposal option.
Methane not harvested that comes into contact with the cover material in the landfill could potentially be oxidized or converted to CO2 before release into the atmosphere. There is conflicting data on the extent of CH4 oxidation by landfill cover soils. In a laboratory study, changes in moisture content resulted in a nearly 5-fold change in methane oxidation rates (Boeckx and Van Cleemput, 1996). Temperature also caused changes in the rate of methane oxidation. Adding ammonia fertilizer to the soil resulted in a decrease in CH4 production with an increase in N2O production. The same bacteria that can produce methane are also able to use the added N and produce nitrogen gas.
Another study found that landfill cover soils can not only oxidize all of the CH4 that reaches the surface soil from below, they are also able to oxidize CH4 from the atmosphere (Bogner et al., 1997), thus releasing carbon. No methane was released from the landfill soil as measured by sampling stations located across the surface of the landfill from the period (June to December) when the chambers were monitored. When methane collection wells at the landfill were shut down for a two day period, CH4 concentrations underneath the cap increased by three orders of magnitude but there was no subsequent increase in CH4 flux from the surface of the soil. The microorganisms that change the methane into CO2 were present in high enough numbers in the landfill cover soil to convert all of the methane into CO2 before the methane was released into the atmosphere. In a US EPA emissions inventory, the amount of methane oxidized from landfills was assumed to be 10 percent (US EPA, 1998).
KING COUNTY LANDFILLING CALCULATIONS
It is possible to estimate the effect on carbon sequestration if King County were to landfill all of the biosolids (anaerobic stabilized secondary cake) generated. Certain assumptions have to be made to complete this estimate. The information presented above shows there are no absolute numbers for determining the amount of CH4 that would be generated by the landfilled biosolids and what portion of that would actually enter the atmosphere. Nor does it show the portion of the CH4 that would come into contact with the landfill cover soils, and either be released to the atmosphere or be oxidized.
The landfill nearest to King County that would accept biosolids is the Columbia Ridge Transfer Station in Arlington, Oregon, operated by Waste Management, Inc. According to Chris Haines, facility manager, approximately 15 percent of the total methane generated is being captured and flared. The remainder is released into the temporary cover soil, where it either remains as methane and is released to the atmosphere or is oxidized to CO2 and released to the atmosphere. An application has been submitted to the State of Oregon to irrigate the material in the landfill, which would increase the rate of methane production and make gas capture and beneficial use financially viable. If this permit is approved, it is likely that energy recovery and use would begin in the near future. However, for this estimate, the current practices at the landfill are being used.
Two other factors need to be calculated before estimating carbon sequestration resulting from landfilling all of King County’s biosolids:
Transportation: Before trying to estimate the amount of methane that biosolids would generate in the landfill, the amount of energy it takes to get them there has to be calculated. For this and all other estimates, we will consider that the trucks used to transport the biosolids get 6 miles/gal, and that 21.6 lbs of CO2 is released for each gallon of diesel consumed. For a King County truck, that translates to approximately 360 lbs of CO2 per 100 miles traveled. The landfill is approximately 250 miles from Seattle, thus each truck would burn 1,800 lbs of CO2 for each round trip to the landfill. If each truck carries 30 wet tons of biosolids, 4,280 trucks are needed to transport all of the biosolids produced in 2002 to this facility – generating 3,850 tons of CO2or 3500 Mt of CO2.
Methane Generation: We will assume that the methane generation capacity of the biosolids is equivalent to 250 ml CH4 g-1, which is in the middle of rates reported for grass clippings and food waste (Eleazer, 1997). In addition, we will assume that 50 percent of the dry weight of the biosolids is organic. We will also assume that the methane production rate is reduced by the low C:N ratio of the biosolids, and that a portion (5 percent) of the decomposition of the organic matter in the biosolids results in the formation of N2O (Borjesson and Svensson, 1997).
The total dry weight of biosolids produced in 2002 was 27,221 dry tons. Dividing by two to take into account the portion of the biosolids that is inorganic, gives a total organic mass of 12,375 metric tons. Here we assume that 95 percent of the organic fraction of the biosolids would produce CH4 as it decomposed and the remaining five percent would produce N2O.
If the biosolids produced by King County in 2002 had gone to the landfill, they would potentially have produced 2099 Mt of CH4 and 23.5 Mt N2O. To express that in terms of CO2 production, this amount of methane is equivalent to 132,750 Mt of CO2 and the nitrous oxide is equivalent to 7,000 Mt CO2.
LANDFILLING – WHAT’S THE NET?
The next factor to consider is the fate of the gases generated in the landfill from biosolids decomposition. Based on the annual temperature at the landfill site, we will assume that the oxidation of methane by the cover soil is 50 percent of the maximum. If 15 percent of the CH4 generated is flared, and of the remainder, 25 percent is oxidized, that means 64 percent of the CH4 generated in the decomposition of the biosolids will be released to the atmosphere. In addition, we will assume that all of the N2O is released to the atmosphere. This means that if all of the biosolids produced in King County in 2002 had gone to the landfill, a total of 85,000 Mt of CO2 would have been released to the atmosphere from the landfill site. As noted in Table 2, if transport and N2O are included in the calculation, the total gas release is over 95,000 Mt CO2.
If the operating process at the landfill changes and gas is harvested for energy use, this balance will change. If, instead of flaring a portion, the methane was harvested for energy recovery, this would count as an energy credit rather than a debit. For the purposes of this estimate, we can assume that collection efficiency would be the same as release efficiency. In this case, landfilling biosolids would generate a net carbon credit of 94,430 Mt CO2 (Table 3).
THE INCINERATION OPTION
Incineration is an alternative disposal option for municipal biosolids. Energy recovery from incinerating biosolids is possible. The energy requirements and potential energy recovery for incineration are described in different engineering texts (Owen, 1982, Metcalf and Eddy, 2001). Energy requirements increase with increasing water content in the biosolids. In addition, the energy value of the sludge decreases with increasing sludge stabilization. For example, an average heating value of raw primary biosolids is 25,000 kj/kg of total solids. This decreases to 12,000 kj/kg total solids for anaerobically digested primary biosolids (Metcalf and Eddy, 2001).
If one includes the heat requirements for all of the other components of the biosolids in addition to the water, the energy generated by incineration is most likely negative for anaerobically digested cake with a moisture content greater than 80 percent. For King County, this disposal option for biosolids would involve a net cost of carbon, rather than a gain in carbon credits.
LAND APPLICATION TO MEET FERTILIZER REQUIREMENTS
Biosolids often are applied to meet the N and P requirements of annual crops. In the Northwest, fertilizer application in commercial forestry operations also is common. In this scenario, biosolids can be considered as a substitute for commercial fertilizers and the energy costs associated with manufacturing commercial fertilizers can be avoided. With this end use, biosolids can be considered as a carbon sink, or a greenhouse gas credit. To calculate the scope of this sink, the energy requirements for N and P fertilizer production must be taken into account.
With nitrogen fertilizer production, atmospheric N is fixed and processed into commercial fertilizers using the Haber—Bosch process – an energy intensive process that consumes a great deal of fossil fuel. In fact, producing the chemical equivalent of one unit of nitrogen requires 1.4 units of carbon (Cole et al., 1993; Izuarralde et al., 1998; Schlesinger, 2000; Sitting;1979).
Phosphate fertilizer is produced by crushing phosphate rock and then spraying it with either sulfuric acid or phosphoric acid. This is also an energy intensive process. Expressed on the same basis as nitrogen and taking into account transportation costs, about 3 units of carbon are required to manufacture, transport and apply 1 unit of P as P2O5 fertilizer.
Biosolids are generally applied to meet the N needs of a crop. Total N in biosolids generally ranges from 4 to 6 percent, with available N being only a small portion of the total. For King County biosolids, total N averaged 5.9 percent at the West Point Treatment Plant (WPTP) and 7.2 percent at the South Treatment Plant (STP). Of this, 17.5 percent of the total N is present as NH3, and 82.5 percent is present as organic N (King County, 2002). About 25 percent of the organic N is available for plant uptake in the year following biosolids application. An average N application rate for most agronomic crops is 165 kg ha-1. With the available N content of the King County biosolids, this would translate into an application that would have 433 kg total N. On a dry weight basis, this would equal 7.34 Mg of WPTP biosolids and 6 Mg of STP biosolids. Assuming 21 percent solids, this would amount to a wet application of 35 Mg of WPTP and 28.6 Mg STP biosolids.
We can also assume that applying biosolids to meet the N needs of the crop would also supply the P needs. Generally P is applied at the same rate (kg ha-1) as N to meet the fertilizer needs of the crop. Although there has been a great deal of research on P bioavailability in different types of biosolids (e.g. Elliot et al., 2002), for this estimate, we will assume that by applying biosolids to meet the N needs of the crop, the P needs will also be met. We will also assume that the N requirements for forestry are equivalent to the N requirements of agronomic crops. For this estimate, we are not taking into consideration the micronutrient or the potassium fertilizer content of the biosolids because micronutrients are not routinely applied to agricultural soils and the potassium content of biosolids is generally low. However, if these were figured into the estimate, the credits associated with using biosolids instead of commercial fertilizer would increase.
For energy calculations, we’ve assumed that the C requirements for producing and applying commercial fertilizer N and P are as stated above and that biosolids are applied at a rate sufficient to supply 165 kg ha-1 N which will supply the same amount of P. For 2001, about 109,000 wet Mg or 23,000 dry Mg were applied to agricultural fields and 1,500 Mg were applied to forest sites. King County applied biosolids to a total of 3,650 ha of land at a fertilizer rate in 2001. The energy savings achieved by using biosolids instead of commercial N and P fertilizers come to 1.5 Mg of CO2 per ha treated.
This carbon credit gained by using biosolids as a fertilizer source to replace commercial N and P has to be altered to factor in the CO2 costs for transporting biosolids to the site. For this analysis, the CO2 costs for land application (meaning the fuel use associated with spreading the biosolids on each hectare of land) of the biosolids are not being considered. They would be a very small fraction of the cost of bringing materials from the treatment plant to the application site and so would not have a significant impact on the calculations. For King County, the average one-way haul distance for biosolids used on agricultural land is 205 miles, or 410 miles round-trip. For forest application, the one way haul distance averages 55 miles, with a round trip equal to 110 miles. This significantly reduces the CO2 credit for agricultural sites with only a minor reduction for forest sites (see Table 4).
For King County, using biosolids as a substitute for commercial fertilizers results in a net savings in CO2 for both agricultural and forest application sites. To maximize this savings, it would be advantageous to reduce the haul distance for the material. This would require higher application to forest lands or identification of agricultural sites with a shorter haul distance. This estimate did not take into account the micronutrient value of the biosolids. In addition, it did not take into account the potential for biosolids addition to soils to increase soil carbon reserves. It is possible that the fertilizer value of the biosolids combined with the potential to increase soil carbon reserves would further add to CO2 mitigation. This will be discussed in Part II, along with a total assessment of the CO2 credits and debits associated with landfilling biosolids versus recycling on agricultural land and in forests.
REFERENCES
Boeckx, P. and O.Van Cleemput. 1996. Methane oxidation in a neutral landfill cover soil: influence of moisture content, temperature and nitrogen-turnover. J. Environ. Qual,. 25:178-183.
Bogner, J.E., K.A. Pokas, and E.A. Burton. 1997. Kinetics of methane oxidation in a landfill cover soil:temporal variations, a whole-landfill oxidation experiment, and modeling of net CH4 emissions. Environmental Science and Tech, 31:2504-2514.
Borjesson, G. and B.H. Svensson. 1997. Nitrous oxide emissions from landfill cover soils in Sweden. Tellus 49B:357-363.
Cole, C.V., K. Flach, J. Lee, D. Sauerbeck, and B. Stewart. 1993. Agricultural sources and sinks of carbon. Water, Soil, Air, Pollut., 70:111-122.
Eleazer, W.E., W.S. Odle, Y.S. Wang, and M.A. Barlaz. 1997. Biodegradability of Municipal Solid Waste Components in Laboratory —Scale Landfills. Environ. Sci. and Tech., 31:911-917.
Elliott, H.A., G.A. O’Connor, and S.R. Brinton. 2002. Phosphorus leaching from biosolids-amended sandy soils. J. Environ. Qual., 31:681-689.
Hilger, H., and M. Barlaz. 2003. Anaerobic decomposition of refuse in landfills and methane oxidation in landfill cover soils. In C.J. Hurst (ed.) Manual of Environmental Microbiology. ASM Press, Washington, DC. Pp. 696-718.
Izaurralde, R.C., W.B. McGill, A. Bryden, S. Graham, M. Ward, and P. Dickey. 1998. Scientific challenges in developing a plan to predict and verify carbon storage in Canadian prairie soils. In R. Lal, J.M. Kimbe, R.F. Follett, B.A. Stewart (eds.), Management of Carbon Sequestration in Soil. CRC Press, Boca Raton, FL pp. 433-446. S592.6.C35 M35 1998 v.1.
King County Wastewater Treatment Division. 2002. Biosolids Quality Summary.
Metcalf & Eddy, Inc. Wastewater Engineering — Collection, Treatment, Disposal. McGraw Hill New York (1991).
Owen, W.F., Energy in Wastewater Treatment. Prentice Hall, Englewood Cliffs, NJ, 1982.
Schlesinger, W.H. 2000. Carbon sequestration in soils: some cautions amidst optimism. Agriculture, Ecosystems and Environ., 82: 121-127.
Sitting, M. 1979. Fertilizer Industry, Processes, Pollution Control and Energy Conservation. Noyes Data Corp. Park Ridge, NJ.
U.S.EPA (U.S. Environmental Protection Agency), U.S. Greenhouse Gas Emissions and Sinks, 1990 — 1996 (1997a).
Sally Brown is a Research Assistant Professor, Soil Remediation, in the College of Forest Resources, University of Washington. Peggy Leonard is manager of the Biosolids Program for the Wastewater Treatment Division Of King County, Seattle, Washington.
CARBON ACCOUNTING EXPLAINED
THE United Nations Framework Convention on Climate Change (UN FCCC) was developed by the international community in response to the recognition that greenhouse gas emissions have been increasing over the last 200 years as a result of anthropogenic activities. As the potential environmental effects of this increase become better understood, the urgency of appropriate carbon accounting becomes more obvious. Carbon accounting keeps track of the volume of greenhouse gases that are either generated or sequestered as a result of human activity. Carbon accounting measures the amount of greenhouse gases released or stored as a result of our activities. The accounting is done in terms of tons of carbon or tons of carbon dioxide gas. Under the auspices of the UN FCCC’s, a meeting was held in Kyoto in 1997. The subsequent Kyoto protocol calls for industrialized nations to reduce their greenhouse gas emissions by five percent by 2008-2012. An integral part of this goal is developing an understanding of our greenhouse gas emissions and sequestration through carbon accounting. The United States is the only industrialized nation that has not signed the Kyoto protocol.
August 15, 2004 | General