New study estimates that volume of landfill-derived methane in U.S. is 466 billion cubic feet per year, of which 66 percent is collected and only 58 percent is utilized.
A.E. Schauer-Gimenez, A.J. Cal, M-C. Morse, A.J. Pieja, K.M. Holtman and W.J. Orts
BioCycle November 2014
 On August 1, 2014, the U.S. Department of Agriculture (USDA), the U.S. Environmental Protection Agency (EPA), and the Department of Energy (DOE) released the Biogas Opportunities Roadmap (see “Federal Biogas Opportunities Roadmap,” September 2014). This multi-departmental program is both a political and technical “call-to-arms” for the biogas industry, outlining voluntary measures that government agencies can implement to increase use of anaerobic digesters. The program describes funding incentives through the 2014 Farm Bill that arguably legitimizes methane/ biogas as a viable resource for the biofuels and bioproducts industries.
With the Biogas Roadmap in place as a backdrop, it is worth answering the following questions:
1) How much biogas is potentially available in the United States?
2) Where is it located?
Recent surveys of U.S. biogas potential have quantified yields using different means and data analyses (EPA, 2013; NREL, 2013; USDA, 2014). The biggest uncertainty lies in estimating the amount of biogas potential based merely on the amount of biomass available, i.e., waste generation models, not on the actual methane produced at each site (actual production data hasn’t been readily available in the U.S. until recently). To help answer the questions posed above, a research project was undertaken by Mango Materials, a California-based bioplastic manufacturer, to provide an estimate of the overall biogas potential solely from landfills in the U.S. with a spatial mapping of domestic methane supplies.
This article, based on the findings of that research is, in part, a survey of these surveys, with the addition of new on-site data that now attempts to estimate biogas production based on the most accurate production numbers from the field, not just on theoretical yield predictions derived from biomass availability. In summary, when actual data from individual landfills is used, it is estimated that there is 26 to 52 percent more methane available from landfills than predicted from biomass quantities. In other words, actual results have proven more optimistic than originally modeled.
Comparison Of Landfill Methane Potential
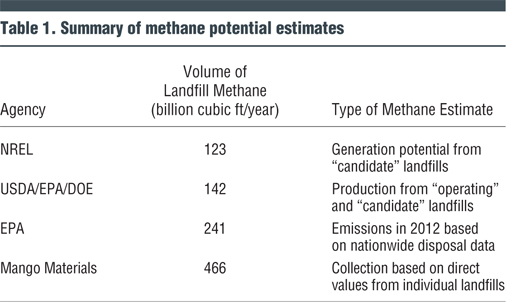
Table 1 summarizes methane potential across the U.S. as identified in the recent surveys cited. These numbers show significantly different methane potentials based on multiple factors, including date of survey, analytical methods and breadth of biomass sources included.
The National Renewable Energy Laboratory (NREL) analyzed the Landfill Methane Outreach Program (LMOP) data and estimated the methane generation potential across the U.S. based on the amount of biomass available (NREL, 2013). The LMOP is a voluntary assistance program managed by EPA that helps encourage the recovery and beneficial use of landfill gas as an energy resource (EPA LMOP, 2014a). The LMOP estimates methane potential for landfill gas-to-energy projects; it considers only landfills that meet requisite criteria, termed “candidate landfills,” defined as one that is either still accepting waste or has been closed for less than five years. These landfills must have at least one million tons of waste, and “must not have an operational or under construction methane utilization project.”
As a result, the NREL report of LMOP landfills underestimates total methane generation potential in the U.S. especially because methane currently utilized for gas-to-energy projects at older landfills is not taken into account. Looking only at candidate landfills ignores smaller landfills and those that have been closed for greater than five years, which still could be emitting viable amounts of methane (EPA LMOP, 2014b). There are many landfills with methane utilization potential that do not meet these criteria. So, based on the relatively conservative estimates from the LMOP analysis, the methane generation potential in the U.S. is 123 billion cubic feet of methane per year (2.5 million metric tons/year), noted in Table 1.
With release of the Biogas Opportunities Roadmap (USDA, 2014), the USDA, EPA and DOE expanded the criteria for methane generation beyond the LMOP database to also include older and smaller landfills with current methane utilization systems. The Biogas Roadmap estimates that 284 billion cubic feet of biogas are being produced annually by landfills, which translates to 142 billion cubic feet of methane, compared to 123 billion from the LMOP report (assuming 50% methane in biogas, a conservative measure). Since the Biogas Roadmap includes a greater number of landfills in its survey, it makes sense that the potential value (Table 1) is greater than the NREL LMOP estimation.
As opposed to the NREL and the Biogas Roadmap, the EPA estimated methane emissions in 2012 in its “Inventory of U.S. Greenhouse Gas Emissions and Sinks” using a model approach (EPA, 2013). This survey is based on nationwide disposal data (which references the BioCycle State of Garbage in America surveys (van Haaren, 2010)). To estimate biogas yields, the EPA study based methane production on a first order decay model described by the Intergovernmental Panel on Climate Change (IPCC, 2006). This model assumes that the degradable organic carbon in the waste decays slowly over several decades, and is a purely theoretical prediction. Importantly, the model accounts for decay rates in various climates across the U.S., and includes methane recovered for gas-to-energy projects (including methane being flared and oxidized). Also, this model accounts for total emissions, not all of which can be easily recoverable. According to EPA’s estimate, there were 241 billion cubic feet per year (4.9 million metric tons) of methane emissions in the U.S. in 2012 (Table 1).
Although previous estimates still show a significant amount of methane available that could be used for bioprocesses and bioproducts, these numbers are still not comprehensive. The research undertaken by the authors used data from the “EPA Facility Level Greenhouse Gas Emissions Database” (ghgdata.epa.gov), which sums up the total amount of methane emitted at each landfill. This database includes the output of individual facilities that emit more than 25,000 metric tons of greenhouse gases per year (as CO2 equivalents), with collection data reported to EPA as of September 1, 2013. The significant advantage of the new analysis is that it is the first major study to directly quantify methane emissions based on actual emission data provided by individual landfills, rather than estimating outputs from biomass conversion predictions.
The EPA Greenhouse Gas Emissions Database also identifies landfills that have gas collection systems on site. When a landfill has a gas collection system, additional information must be reported to EPA and is included in the database. Data include annual volume of landfill gas collected, annual average methane concentration, and estimated gas collection efficiency. The annual volume of landfill gas collected in 2012 is reported in standard cubic feet, and that number was multiplied by the percent of methane found in the landfill gas in order to obtain the amount (standard cubic feet) of methane collected in the landfill gas collection systems. The authors used this method to calculate the amount of methane collected for each individual landfill with a collection system.
Gas collection systems often have leaks that may cause methane to be inadvertently released to the atmosphere rather than collected. Therefore, the landfill gas collection efficiency value was considered as “emissions” in the analysis. In this case, emissions means the amount of methane that is not collected and vented into the atmosphere. The efficiency of a system can be difficult to determine since it is dependent on the age/phase of the individual landfill and the pressure and concentration difference across the landfill cover (Amini, 2012). In general, EPA has accepted an assumption of 75 percent efficiency if the actual value cannot be obtained; this number is based on surveys of industry estimates and is under much debate (Huitric, 2006). More than 90 percent of the landfills in the GHG database reported efficiencies, and the efficiencies ranged from 47 to 95 percent, with a median of 75 percent.
For landfills that do not collect their gas, methane emissions were reported to the EPA as metric tons of carbon dioxide equivalents and were converted to methane emissions based on the assumption that the global warming potential of methane is 21 times that of carbon dioxide (IPCC, 2007; EPA, 2014c). The resulting weight was converted to a volume using the density of methane at standard temperature and pressure.
Using the EPA Greenhouse Gas Emissions Database to assess the methane produced at individual landfills, the volume of landfill-derived methane in the U.S. is estimated to be 466 billion cubic feet per year (Table 1, bottom line).
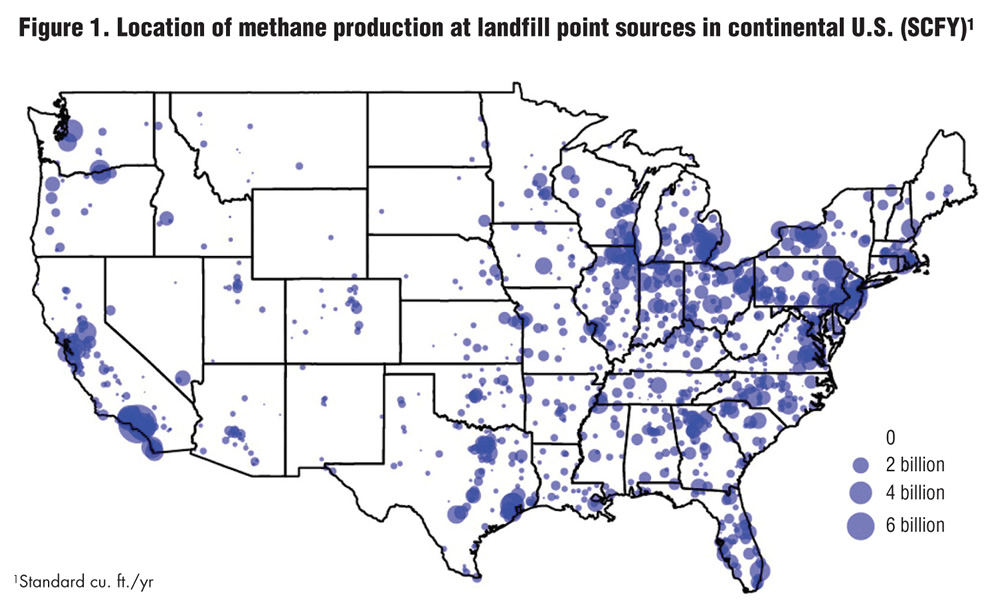
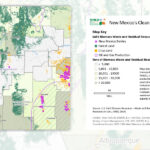
Figure 1. Location of methane production at landfill point sources in continental U.S. (SCFY)
Distribution, Quantification Of Landfill Methane Potential
Figure 1 shows the distribution of landfill-derived methane in the U.S. As expected, methane production is most concentrated around urban centers, especially on the coasts and in the Midwest. In a nutshell, the majority of methane production sites are clustered near major metropolitan areas with large numbers of consumers.
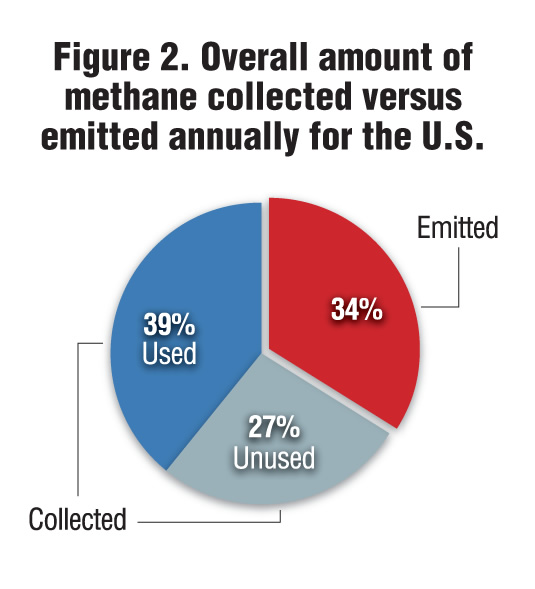
Figure 2. Overall amount of methane collected versus emitted annually for the U.S.
Figure 2 illustrates the amount of methane collected or emitted in each individual state. Collected and unused methane includes gas that is flared on-site; emitted methane includes methane released at landfills not collecting their gas as well as methane that is lost through inefficiencies in methane collection systems. The amount of methane used for current methane utilization projects (electricity, heat, etc.) was reported in the LMOP operational landfills database. Available methane is calculated as the total methane produced (using the GHG database) minus methane used (from LMOP database).
California has the highest overall collection and emission of methane, collecting 45 billion cubic feet per year and emitting 13 billion cubic feet per year. Only about 40 percent of the methane generated in California is utilized for energy projects, while the remainder is either collected and flared or goes uncollected, representing a source of GHG emissions in a state with carbon credits and aggressive emissions standards. Overall, California is representative of the national trend for treating landfill gas; gas utilization is mostly performed at larger landfills where economic practicality dictates usage. In reality, the abundance of landfill gas generated that is either collected and flared or not collected could be used as a basis for energy/product development and could support conversion of local municipal and agricultural organic wastes to methane through use of infrastructure already in place.
Potential For Collection And Use
One concern for the biogas industry is the disconnect between collecting biogas and actually using it for a value-added product. To get an idea of how much methane is used from landfills for heat or electricity, the LMOP operational projects database (www.epa.gov/lmop/projects-candidates/operational.html) was utilized. This database provides information on current projects that use landfill gas in the U.S., including the type of project and flow of landfill gas to each project. To do the calculation, the quantity of landfill gas was converted to methane based on the methane percentage for the individual landfills, reported in the EPA Greenhouse Gas Emissions Database.
From this breakdown, it is estimated that 66 percent of landfill-generated methane, or 310 billion cubic feet of methane per year (of the total 466 billion cubic feet of methane produced annually), is collected; however, only 58 percent, or 180 billion cubic feet of methane, is currently being utilized (Figure 2). Methane currently emitted as well as methane that is collected and unused could be converted into valuable by-products, reducing greenhouse gas emissions.
It should be noted that during the lifetime of a landfill, the gas is typically generated at a stable rate for 20 years, and will continue to be emitted for 50 years after the landfill is closed (US ATSDR 2001). The authors’ study also found that collection efficiencies increase as landfills age: closed landfills in our study had an average collection efficiency of 0.87, compared to 0.68 for open landfills. This trend is partially offset by a decrease in methane percentage in biogas as landfills age: gas at closed landfills was 42 percent methane on average, compared with 48 percent at operational landfills.
Although a variety of uses could provide added value, a majority of landfill methane is being used in two ways — burned directly for heat or used to generate electricity (EPA LMOP, 2014b). Of the 638 methane utilization projects in the LMOP database, the majority (451) generates electricity. This accounts for 65 percent of all the methane used in the U.S. at an amount of 116 billion cubic feet per year. The other uses can be categorized as heat (boiler, cogeneration, direct thermal, greenhouse, and leachate evaporation) and fuel (high Btu, medium Btu, alternative fuel). The amount of methane used to produce heat at landfills is 26 billion cubic feet per year (15% of total methane used). Using methane to inject into the natural gas pipeline or make alternative fuels is relatively new and therefore only accounts for 13 percent of the total methane used in the U.S. (22 billion cubic feet per year).
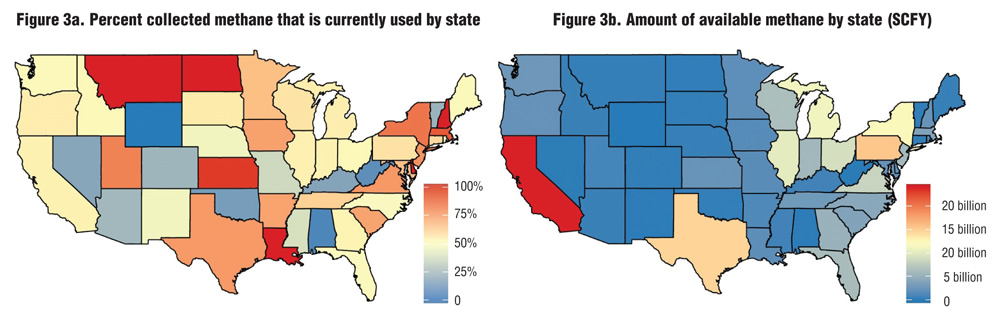
Figure 3a. Percent collected methane that is currently used by state
Figure 3b. Amount of available methane by state (SCFY)
The fraction of landfill-derived methane currently employed for a heating or electricity project varies greatly from state to state. Hawaii and Wyoming do not use any of their landfill-derived methane; Alabama, West Virginia and Oklahoma use less than 15 percent of their landfill-derived methane (Figure 3a). California has the largest total amount of collected, unutilized methane — over 21 billion cubic feet per year — while Pennsylvania, Ohio, Michigan and Texas all have over 10 billion cubic feet of collected methane that is not currently put to use.
Overall, a significant quantity of collected landfill-derived methane is currently not utilized, and the bulk of this underutilized resource is adjacent to major metropolitan areas. For example, the top 10 states with the highest amounts of collected methane available (CA, PA, MI, IL, OH, FL, IN, WI, TX, GA) have 84 billion cubic feet of methane that is collected but unused (Figure 3b). These are states with large metropolitan areas (Los Angeles, Dallas, Chicago) that would greatly benefit from methane utilization projects.
Anne E. Schauer-Gimenez, Margaret-Catherine Morse and Allison J. Pieja are with Mango Materials in Redwood City, California. Andrew J. Cal, Kevin M. Holtman and William J. Orts are with the Western Regional Research Center, Agricultural Research Service, U.S. Department of Agriculture in Albany, California.
Acknowledgements
The authors would like to thank Alan Zhang and Nancy Schauer for their assistance with the data compilation and Bob Gelardin for his visionary efforts.