BioCycle May 2011, Vol. 52, No. 5, p. 50
Sally Brown
Long time readers of this column may remember the one titled, “Landfill Gas Math” (December 2009) where I did back of the envelope calculations to answer a question posed by Matt from Michigan. Matt works for the Michigan Department of Environmental Quality and had been trying to preserve the state’s ban on landfilling yard trimmings. The companies interested in overturning that ban had argued that landfilling the waste would provide a large quantity of green energy. In that column, crude calculations showed that only minimal quantities of electricity would be generated by allowing yard trimmings back in the landfill.
The column generated quite a response, including a registered letter to BioCycle from a solid waste management association, several emails pointing out minor (in the big picture) errors in my calculations, and even more emails saying how useful the column was.
Several weeks ago, I received another inquiry regarding landfilling of organic wastes. Josh, who writes for Mother Jones, called to ask for a direct comparison of landfilling and composting – not so much a green energy question but a broader comparison comparing the greenhouse gas (GHG) debits and credits. I suggested that controlled anaerobic digestion would also be worth including in this mix. I pointed out that controlled digestion can get methane out of substrates in weeks rather than years, likely in much higher quantities than landfills.
Take food waste, for example. In both studies and in practice, the methane from food waste is gone in about 2 weeks. While no one has taken time lapse pictures of bananas degrading in landfills, crediting protocols (GHG protocols that give carbon credits for taking material out of landfills) go out at least 10 years. Decay rate constants indicate the majority of the methane from the banana peel will be gone in the first few years, but there will still be some amount left for the next seven years. The accompanying sidebar elaborates on assumptions related to decay rates and landfill methane capture.
Answering Josh’s question is very timely. Bans of landfilling yard trimmings have been overturned recently in Florida and Georgia. Organics disposal proponents appear to be ready to make another assault in Michigan; other states with bans are being targeted as well.
SOME SIMPLE CALCULATIONS
Once again, we can use some pretty simple calculations to shed light on the appropriate home for organic residuals. And from these numbers, numbers that only show the energy and GHG side of the story, it is clear that keeping these organics out of the landfill is the environmentally best answer, hands down. Hopefully this comparison will be helpful in our efforts to put organics to the highest and best use.
So let me tell you how I’ve done it this time.
Quantity of Methane Released: To calculate how much methane is released from food scraps and yard trimmings when they are landfilled, I used values from the Clean Development Protocol as adapted to the Chicago Climate Exchange protocol for methane avoidance for diverting organic feedstocks from landfills to composting facilities. These values use a fairly conservative rate of decay for both feedstocks. They also use a high rate of methane generation for materials in landfills. Actual decomposition in landfills is likely to be less efficient (far from ideal moisture, temperature and pH will both slow down and reduce the amount of methane generated from organics).
Methane Capture At Landfill: I calculated both materials using a solids content of 25 percent. For methane capture at the landfill, I used two cases – one with gas collection after 3 years (standard operating procedure) with a 75 percent collection efficiency while the systems are operating. For the second case, I assumed gas collection from Day 1, also with a 75 percent capture efficiency.
Controlled AD: For controlled anaerobic digestion, I used gas production values for food waste from a study by Zhang et al., (2007) where food waste was digested in a controlled digester. This study formed the basis for the East Bay Municipal Utilities District’s (EBMUD in Oakland, CA) food waste digestion program. For yard trimmings, I used values from the Eleazer et al. study (1997) where nutrients and water were added to branches, grass and leaves and each feedstock was digested separately. I considered yard trimmings in controlled digestion to be an equal mix of the three.
Carbon Offsets: To convert methane (CH4) to electricity and determine the CO2 offsets associated with CH4 for electricity, I used values from a publication by Brown (me) et al., (2010) that was done to look at GHG balances for different biosolids end use/disposal options. Here I used an average value of 300 g CO2e/kWh for the GHG costs of electricity and associated credits.
Composting: For composting, credits are given for CH4 avoidance, electricity avoidance (for material that is digested in a controlled facility before composting), soil carbon accumulation (based on an average value of 0.12 Mg C per dry Mg compost applied). I’ve assumed that the compost was made from 33 percent food scraps and 66 percent yard trimmings and that composting resulted in total volume reduction of about 50 percent. The values for soil C sequestration can be seen in the supplemental material in the Brown et al. study and are from field sampling across a range of sites in Washington state, and parts of Canada. For nutrient content of the compost, I used average values for N, discounted P and the other nutrients and used the CO2 values to make fertilizer that are also shown in the Brown et al. paper (very glad I wrote that paper).
Finally, all calculations were checked by Ned Beecher, director of the North East Biosolids & Residuals Association. Ned has many gifts; the ability to add and multiply are just two of them.
AND HERE IS WHAT YOU GET:
Figures 1-4 tell the story. Negative numbers mean credits. Figure 1 shows carbon credits from power generation from methane collected in dedicated digesters and sanitary landfills. You do get some credits from collecting landfill gas and using it for electricity. You can also see that the values used for quantities of gas from food and yard trimmings in landfills are pretty generous in this protocol. As landfills are not so efficient, the real values are likely significantly lower. But let’s be generous.
If you look at the methane emissions (Figure 2), you see a very different picture. Here I used a 75 percent collection efficiency. If that really gets you ruffled, just look at the case where gas collection starts at Day 1. Please also notice that the high CH4 yields from landfills that give greater energy credits also give higher emissions. Also note that there are no fugitive emissions from controlled digestion – just good and no bad.
Next thing to look at is when you add the credits and debits together (Figure 3). The thing to remember here is that numbers less than zero are credits and numbers greater than 0 are debits, i.e., net GHG emissions. Looks to me like a no brainer….
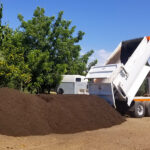
And then you can add in composting (Figure 4). Here I’ve shown the GHG balance for taking material in the transport truck to a composting facility (direct diversion) as well as composting after controlled digestion (post digestion). With controlled anaerobic digestion, you can have your cake and compost it too.
These are conservative calculations that tell a pretty clear story. Even though I used colors in the graphs, the story is black and white. I’ve given you guys in the field some pretty powerful ammunition here. Let’s continue on with the good fight!
Sally Brown – Research Associate Professor at the University of Washington in Seattle – authors this regular column. E-mail Dr. Brown at slb@u.washington. edu.
REFERENCES
Brown, S., A. Carpenter, and N. Beecher. 2010. Calculator tool for determining greenhouse gas emissions for biosolids processing and end use. Environ. Sci. & Tech., 44: 9505-9515.
Clean Development Mechanism. 2008. Tool to determine methane emissions avoided from disposal of waste at a solid waste disposal site, version 04, EB 41. UNFCC/CCNUCC: htp://cdm.unfccc.int/methodologies/PAmethodologies/approved.html
Eleazer, W.E., W.S. Odle, Y. Wang, and M.A. Barlaz. 1997. Biodegradability of municipal solid waste components in laboratory-scale landfills. Environ. Sci. Technol., 31:911—918.
Zhang, R., H.M. El-Mashad, K. Hartman, F. Wang, G. Lui, C. Choate, and P. Gamble. 2007. Characterization of food waste as a feedstock for anaerobic digestion. Bioresour. Technol., 98:929—935.
p. 50 sidebar
WHAT DO WE KNOW ABOUT LANDFILLS?
IN my work preparing background documents for carbon protocols for both the Chicago Climate Exchange (CCX) and Climate Action Reserve (CAR), I’ve ended up learning a lot about landfills. It is important to note that landfills provide an important service that we have all come to count on. Currently, there is a major focus on green energy from landfills. It is clear that methane is produced in landfills – no one argues about this. The questions relate to how much, when, how efficiently and how efficient is gas collection and use? Picking a few random states from BioCycle’s most recent State of Garbage in America survey (October 2010), here are the limited answers that you get (Table 1).
First, many but not all landfills have gas collection systems. No information here or from the US EPA Landfill Methane Outreach Program (http://www.epa.gov/ lmop/projectscandidates/index.html#map-area) on when this gas collection actually starts. Legally, for landfills of a certain size constructed after a particular time, gas collection is required from 2 to 5 years after waste is deposited into a cell.
There is also very limited information on how rapidly organics degrade in landfills and how much methane they produce in landfills in comparison to controlled digesters. A previous column detailed the specifics of anaerobic decomposition, and the different microbial communities involved and feedback loops (see “Picky Eaters,” March 2010). Landfills are unlikely to have optimal conditions for decomposition. In fact, a recent article identified a new type of methanogen that lives in landfills and can tolerate acidic conditions (http://www.sciencedaily.com/releases/2011/04/110406102139.htm).
A key component of the protocol development process was figuring out how quickly materials decompose in landfills. These “decay rate constants” were the source of lengthy discussions in the CCX protocol development process. The constants have largely been derived from lab tests where conditions have been optimized to accelerate decomposition and methane production. When I say optimized, I mean moisture kept high, nutrients added, pH kept high, and microbial inoculums added (ELeazer et al., 1997).
In contrast to these lab studies, there are a few studies where materials have been excavated from landfills. One of my favorites found that only 18 percent of woody material had decomposed after 46 years in a sanitary landfill in Sydney, Australia (Ximenes et al., 2008). Another found limited decomposition of paper waste in sanitary landfills in Germany (Bäumler and Kögel-Knabner, 2008). To my knowledge, no one has looked for or found food waste in one of these digs.
The numbers I used to estimate methane production in this month’s column were based on the decay rate constants developed in the lab studies. As I said, they are likely incorrect, with less methane produced than the constants predict. Also some materials, e.g., wood waste, are likely to remain intact in the landfill while other residuals, such as food scraps, may decay more quickly than predicted.
Another critical part of this discussion is how much methane escapes – either before collection systems are in place, or while they are operating. Again, no clear answers. Some studies suggest that when gas collection systems are operational, efficiency is better than 90 percent. EPA estimates it is 75 percent. Other studies show large variability based on where and when you sample. Because methane has such a high CO2e value, it only takes a little escaping to the atmosphere to cancel benefits associated with the captured methane that is turned into electricity.
Because of these many levels of uncertainty, putting organics into a landfill is clearly not the best way to make energy from these feedstocks. The values on GHG balances provided in the column should be taken as estimates and not quantitative values.
REFERENCES
Bäumler, R. and I. Kögel-Knabner. 2008. Spectroscopic and wet chemical characterization of solid waste organic matter of different age in landfill sites, Southern Germany. J. Environ. Qual., 37:146-153.
Ximenes, F.A., W.D. Gardner, and A.L. Cowie. 2008. The decomposition of wood products in landfills in Sydney, Australia. Waste Management, 28:2344-2354.
May 17, 2011 | General