While only a small amount of wood processing residues are available for recovery, the urban wood waste stream has nearly 29 million tons to tap.
Bob Falk and David McKeever
BioCycle August 2012, Vol. 53, No. 8, p. 30
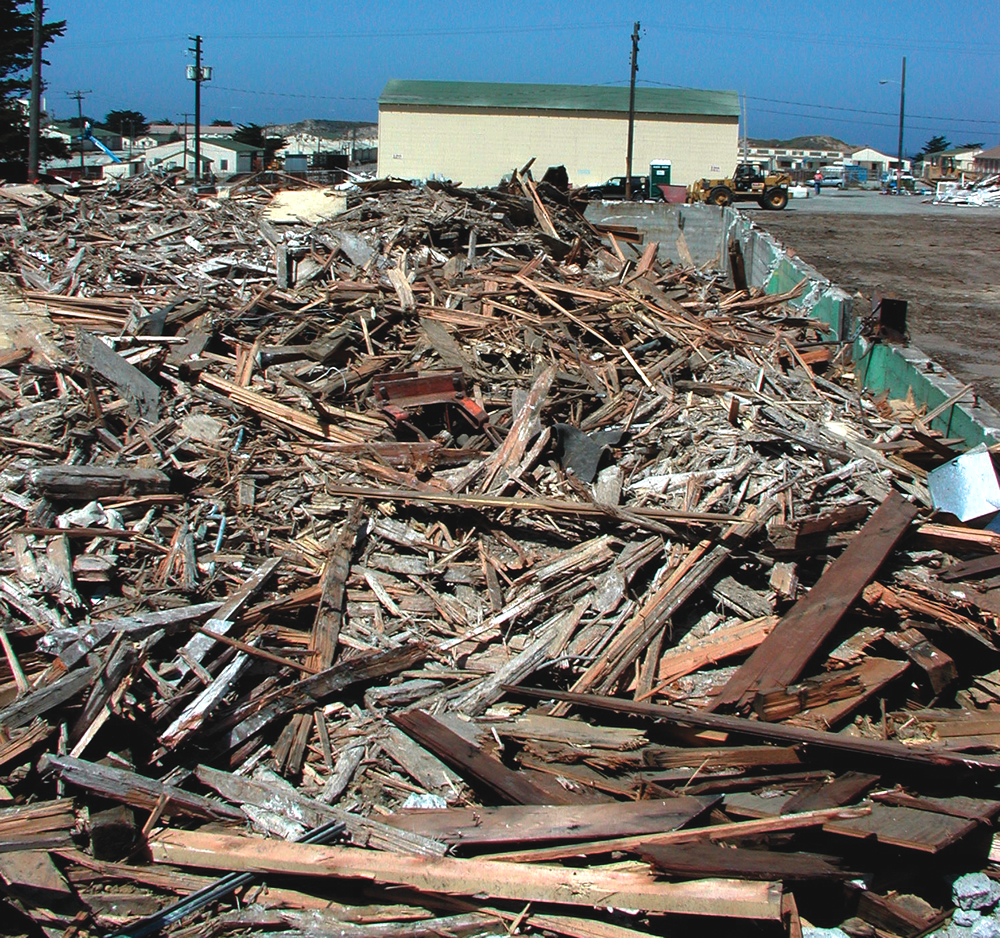
About 130 million tons of C&D debris were generated in 2010, including about 36.4 million tons of wood. Demolition accounted for about 80 percent of the wood debris.
Over the past 30 years, an average of 143.3 million tons of wood-based products was produced annually in the United States (Howard 2012). The manufacture of these products generated about 84 million tons of wood residue (about 40% fine residue, including sawdust, and about 60% coarse residues), with more than 98 percent used by the wood products industries for fuel, pulpwood and feedstock for products such as particleboard (Smith and others 2009, Table 1). In addition to this wood residue, a tremendous amount of wood ends up in the North American municipal and construction and demolition (C&D) waste streams. According to waste characterization data from the U.S. Environmental Protection Agency (EPA) and Natural Resources Canada (NRCan), the Forest Products Laboratory estimates that wood makes up over 10 percent of all waste generated in North America (USEPA 2009, NRCan 2006).
In 2010, 70.6 million tons of solid wood waste were generated in the manufacture, use and disposal of solid wood products in the United States (Table 1). This waste wood comes from a variety of sources and in a variety of forms. Its principal sources are municipal solid waste (MSW) and C&D waste. Each generates distinctly different types of wood waste, with differing degrees and levels of recovery and recyclability. (For this report, storm-related debris is not accounted for as no reliable estimates on a national level are available; this may be accounted for in future estimates, especially given the frequency and intensity of storms that are generating this wood waste stream.)
While other building materials such as concrete and steel have robust recycling industries, wood has yet to reach the same levels of diversion. According to the Steel Recycling Institute, the recycling rate for structural steel is about 98 percent in North America. Concrete recycling is reported at about 82 percent, according to the Construction Materials Recycling Association (CMRA).
Wood Waste By Sector
MSW
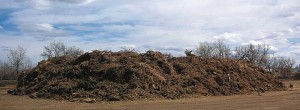
Yard trimmings are about 55 percent wood and 45 percent herbaceous material. In 2010, over 33 million tons were generated.
By EPA definition, two components of MSW, “wood” and “yard trimmings,” contain solid wood. The wood component includes items such as wooden furniture and cabinets, pallets and containers, scrap lumber and wooden panels, and wood from manufacturing facilities. It does not include roundwood, unprocessed wood, repaired wood, or recycled pallets. Yard trimmings include leaves and grass clippings, brush, and tree trimmings and removals.
In 2010, the EPA estimated that about 15.9 million tons of MSW wood waste were generated, with a recovery rate of only 15 percent (not counting recovery for energy combustion). Over 33 million tons of yard trimmings were generated the same year, but they were recycled at a much higher rate of 58 percent (USEPA 2010). Yard trimmings are about 55 percent wood (18.4 million tons) and 45 percent herbaceous material (15.0 million tons) (Falk and McKeever 2004, McKeever 2004).
As indicated in Table 1, the total wood waste in the MSW (34.3 million tons) is about 14 percent of the total MSW (250.2 million tons); however, the amount of wood in MSW varies by region. Staley and Barlaz (2009) summarized waste characterization data from 11 U.S. states and found that the solid wood component varied from about 4 percent to about 16 percent of MSW.
C & D Waste
Construction and demolition waste is often thought of as a single form of waste because both types are typically discarded together in landfills. But since construction and demolition wastes originate from distinct types of activities, have different characteristics, and differ in their ease of separation, recovery and recyclability, they are in fact different. Construction waste originates from the construction, repair and remodeling of residential and nonresidential structures. Demolition waste originates when buildings or other structures are demolished and is often contaminated with paints, fasteners, adhesives, wall covering materials, insulation and dirt and typically contains a diverse mix of building materials.
In 2010, an estimated 130 million tons of C&D debris were generated in the U.S. This debris contained about 36.4 million tons of wood. Demolition activities accounted for just over 80 percent of the wood debris, and construction activities covered the balance. Estimates reported here for C&D waste are based on generation and recovery rates developed in McKeever (2004) and Falk and McKeever 2004), which were applied to current economic drivers such as housing completions, value of nonresidential construction,and population change. The continued general economic recession in the United States has had a marked effect on wood waste generation, principally in new residential construction. Of the 36.4 million tons of C&D wood generated, nearly 17.3 million tons were deemed recoverable (Table 1).
As with the MSW waste stream, the wood component of the C&D waste stream varies by region. Staley and Barlaz (2009) found that the wood varied from about 25 percent to about 55 percent. As indicated in Table 1, the total amount of wood in the C&D waste stream (36.4 million tons) is about 28 percent of the C&D waste stream (130 million tons).
Other Sources
Other sources of waste wood include chemically treated wood from railroad ties, telephone and utility poles and pier and dock timbers; chipped brush and limbs from utility right-of-way maintenance; and industrial waste wood outside the normal waste streams. Some of this material is being reused, burned or disposed in hazardous waste landfills, but much is being left on site. Chemical treatments and costs of collection make much of this material difficult to recover. The amounts of wood available from these other sources are fairly small and are therefore not included in this discussion.
Summary
In 2010, 70.6 million tons of urban wood waste were generated (Table 1). This figure includes MSW (48%) and C&D waste (52%). Residues from primary timber processing mills are not included because essentially all are currently being recovered. Nearly 29 million tons of waste is deemed to be available for recovery after allowing for current levels of recovery, combustion and unusable material. The MSW could supply about 39 percent of available wood, and the C&D waste stream could supply the balance at 61 percent.
Bob Falk is a Research Engineer and David McKeever is a Research Forester at the Forest Products Laboratory, Madison, Wisconsin.
References
California Integrated Waste Management Board. 2009. California 2008 statewide waste characterization study. Seattle, WA: Cascadia Consulting Group, Inc. http://www.calrecycle.ca.gov/Publications/default.asp?pubid=1346.
Delaware Solid Waste Authority. 2007. Statewide waste characterization study, 2006–2007. Dover, DE: Delaware Solid Waste Authority. www.dswa.com/pdfs/reports/Statewide%20Waste%20Characterization%20Study%202006-2007.pdf.
Falk, R.H.; McKeever, D.B. 2004. Recovering wood for reuse and recycling: a United States perspective. In: Gallis, C.T., ed. Management of recovered wood: recycling, bioenergy, and other options. European COST E31 conference. April 22–24, 2004. Thessaloniki, Greece: University Studio Press: 29–40. http://www.treesearch.fs. fed.us/pubs/7100.
Franklin Associates. 2005. Characterization of building-related construction and demolition debris in the United States. Prepared for: U.S. Environmental Protection Agency. Contract No. 68W02-036, Work Assignment 3-06. Washington, DC: U.S. Environmental Protection Agency.
Georgia Department of Natural Resources. 2010. Statewide construction and demolition debris characterization study. St. Paul, MN: R.W. Beck, Inc. http://www.gasustainability.org/sites/uploads/sustain/pdf/FinalCDReport.pdf. 195 p.
Howard, J.L. 2012. U.S. timber production, trade, consumption, and price statistics, 1965–2010. Table 8b. Madison, WI: U.S. Department of Agriculture, Forest Service, Forest Products Laboratory. [In progress].
Iowa Department of Natural Resources. 2011. Iowa statewide waste characterization study. Des Moines, IA: Department of Natural Resources. http://www.iowadnr.gov/Portals/idnr/uploads/waste/wastecharacterization2011.pdf
Massachusetts Department of Environmental Protection. 2008. 2007 Massachusetts construction and demolition debris industry study. Windsor, VT: DMS Environmental Group. http://www.mass.gov/dep/recycle/reduce/07cdstdy.pdf. 51 p.
McKeever, D.B. 2004. Inventories of woody residues and solid wood waste in the United States, 2002. In: Proceedings of the ninth international conference, inorganic-bonded composite materials. October 10–13, 2004. Vancouver, British Columbia, Canada. 15 p. http://www.treesearch. fs.fed.us/pubs/9135.
Minnesota Solid Waste Management Coordinating Board. 2000. Statewide MSW composition study: a study of discards in the state of Minnesota. St. Paul, MN: R.W. Beck, Inc. 218 p. http://www.pca.state.mn.us/index.php/view-document.html?gid=13502.
NRCan. 2006. An analysis of resource recovery opportunities in Canada and the projection of greenhouse gas implications. Prepared by: Sinclair, R. for Natural Resources Canada. [March]. 343 p. http://www.nrcan.gc.ca/sites/www.nrcan.gc.ca.minerals-metals/files/pdf/mms-smm/busi-indu/rad-rad/pdf/rrd2-eng.pdf.
Oregon Department of Environmental Quality. 2004. 2002 Oregon solid waste characterization and composition. Eugene, OR: Oregon Department of Environmental Quality. 102 p. http://www.deq.state.or.us/lq/pubs/docs/sw/WasteComp2002.pdf.
Smith, W.B., tech. coord.; Miles, P.D., data coord.; Perry, C.H., map coord.; Pugh, S.A., data CD coord. 2009. Forest resources of the United States, 2007. Gen. Tech. Rep. WO-78. Washington, DC: U.S. Department of Agriculture, Forest Service, Washington Office. 336 p. http://www.treesearch.fs.fed.us/pubs/17334.
Staley, B.F.; Barlaz, M.A. 2009. Composition of municipal solid waste in the United States and implications for carbon sequestration and methane yield. Journal of Environmental Engineering. 135(10): 9 p. http://people. engr.ncsu. edu/barlaz/resources/jeecseq.pdf.
USEPA. 2009. Estimating 2003 building-related construction and demolition materials amounts. Washington, DC: U.S. Environmental Protection Agency. [March]. 60 p. http://www.epa. gov/osw/ conserve/rrr/imr/cdm/pubs/cdmeas.pdf.
USEPA. 2010. Municipal solid waste generation, recycling, and disposal in the United States: facts and figures for 2010. Washington, DC: U.S. Environmental Protection Agency. 12 p. http://www.epa.gov/osw/nonhaz/municipal/pubs/msw_2010_factsheet.pdf.
USEPA. 2011. Materials characterization paper in support of the final rulemaking: identification of nonhazardous secondary materials that are solid waste construction and demolition materials—building-related C&D materials. Washington, DC: U.S. Environmental Protection Agency. [February 3].
Wisconsin Department of Natural Resources. 2010. 2009 Wisconsin statewide waste characterization study. Madison, WI: Department of Natural Resources. http://dnr.wi.gov/topic/recycling/documents/wi_wcs_final_report_june-30-2010.pdf[.


