Going forward, reporting on zero waste performance should offer both a total waste generation figure and a diversion figure to ensure that every zero waste undertaking includes prevention.
Andrew Shakman
BioCycle December 2013
I love the concept of “zero waste.” It establishes a bold vision for the future, a world in which intelligent materials management renders waste extinct. The term is powerful because it describes a desired end-state while also serving as a call-to-action, right now, today.
Many waste management professionals have responded to this “charge” over the last decade, but some of the most visible zero waste work related to organics has occurred in food service in recent years. Partnerships have formed between food service operators and waste management professionals to divert preconsumer and postconsumer food waste as well as compostable disposable packaging at zero waste events, zero waste venues, and via zero waste catering programs. With more than 40 percent of the food produced in America lost or wasted, these are clear steps in the right direction.
Problematic Reality
Within all this positive activity, however, there is a problematic reality. In the process of telling the zero waste story in food service, we have simplified the concept to a point where we have lost sight of some essential elements. Rather than communicating a broader zero waste philosophy of resource efficiency and resource recovery, the industry has focused on achieving 90 percent diversion rates while ignoring the total amount of waste generated and the role of prevention. We should all be troubled by imprecise use of the phrase “zero waste” because language conveys meaning and serves as a critical framing mechanism. When we claim “zero food service waste” while still generating any waste we invite legitimate skepticism.
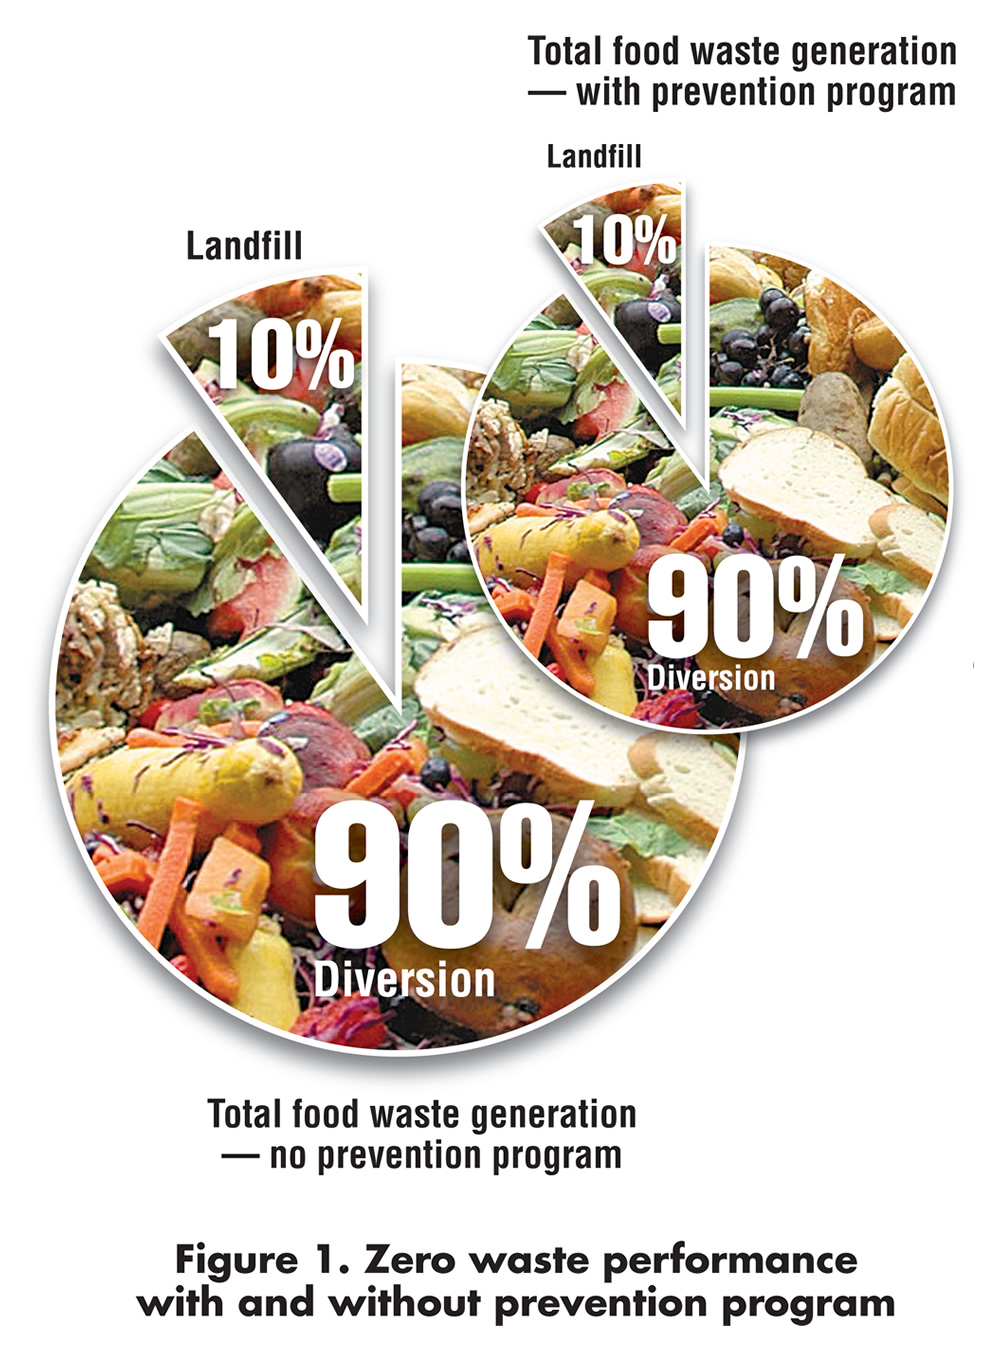
Figure 1. Zero waste performance with and without prevention program
When reflecting on language, insight can be drawn from the robust debate about proper use of the terms “global warming” and “climate change.” Both convey meaning and on the surface appear to refer to the same concept, but within the scientific community global warming refers to surface temperature changes whereas the term “climate change” refers to a broader range of changes that occur as a result of increasing carbon dioxide in the atmosphere (such as changes to sea levels and precipitation patterns). Precise vocabulary matters as we talk about an issue as important as climate change and all the associated strategies to prevent, mitigate or remedy different pieces of the equation. The words we select are themselves a powerful force for change.
How should industry react to this problematic reality? Here are three specific recommendations:
1. Measure Progress Based on Total Waste Generation
Diversion rates matter. But total waste generation levels matter even more. Imagine a hypothetical situation in which a zero waste aspirant achieves 90 percent diversion while experiencing a 100 percent increase in total waste generation (Figure 1). Do they really have anything to celebrate? Is there anything “zero” about doubling waste generation? Unfortunately, current approaches focus almost entirely on diversion rates without the critical context of total generation figures. One measure without the other fails to provide a complete sense of performance.
We need to change our zero waste measurement expectations. Going forward, whenever we report on zero waste performance we should offer both a total waste generation figure and a diversion figure. Figure 1 illustrates this with food waste. We should expect reduction in total waste generation and an increase in diversion rates. This approach would ensure that every zero waste undertaking includes both prevention and diversion initiatives. Sadly, many of these efforts today completely ignore prevention in any formal way.
To expand on this concept of diversion without prevention, consider the journey of a wasted sandwich (Figure 2). Each component of that sandwich has its own story to tell in terms of the resources, energy and effort it took to get onto the plate. That lettuce was harvested, washed, transported, refrigerated and stored. The meat was butchered, processed and transported. The grain for the bread was harvested and ground. The list goes on and on, but many times we forget about these seemingly “invisible” upstream resources that it takes to get foods from the farm to the kitchen. We also don’t see the emissions to air, soil and water. If we simply divert this waste stream, we avoid the landfill impact of the organic waste but we ignore the much larger environmental impact from the agricultural system that created the food we diverted.
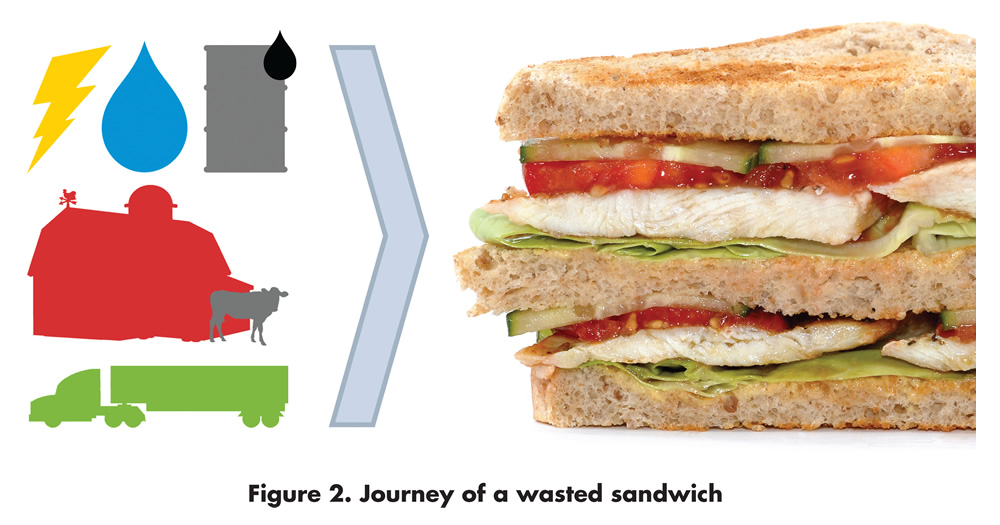
Figure 2. Journey of a wasted sandwich
It just isn’t fair to say, “we have a zero waste program,” if we cannot also say we have a formal prevention initiative in place that can be measured and tracked over time.
2. The Zero Food Waste Hierarchy
The EPA Food Waste Recovery Hierarchy is a concise and powerful framework for thinking about the order and range of organic waste management priorities. Because it is a simple diagram representing a range of complex topics, it works as a communications tool for most any level of staff in a food service organization.
My recommendation is to combine the concept of “Zero Waste” with the steps in the hierarchy to create a hybrid tool: the Zero Food Waste Hierarchy (Figure 3). This tool would be used to first report on the percentage of total waste prevented, then calculate the waste percentages diverted at each level of the hierarchy below prevention. Using a college dining hall as an example, the baseline generation of food waste is 3,200 lbs/week. The dining hall implements waste prevention, decreasing generation to 2,700 lbs/week, a 16 percent reduction. The amount donated is 700 lbs (26%); 400 lbs are converted to industrial uses (15%), 1,300 lbs are composted (48%) and 300 lbs are landfilled (11%).This would guide those aspiring to zero waste to find the highest and best use for products that would otherwise be wasted. By tracking diversion at each tier, we would bring a quality of diversion (“QOD”) measure to the zero waste conversation. If we achieve more impact at a higher level, isn’t that clearly preferable to higher diversion rates at a lower level?
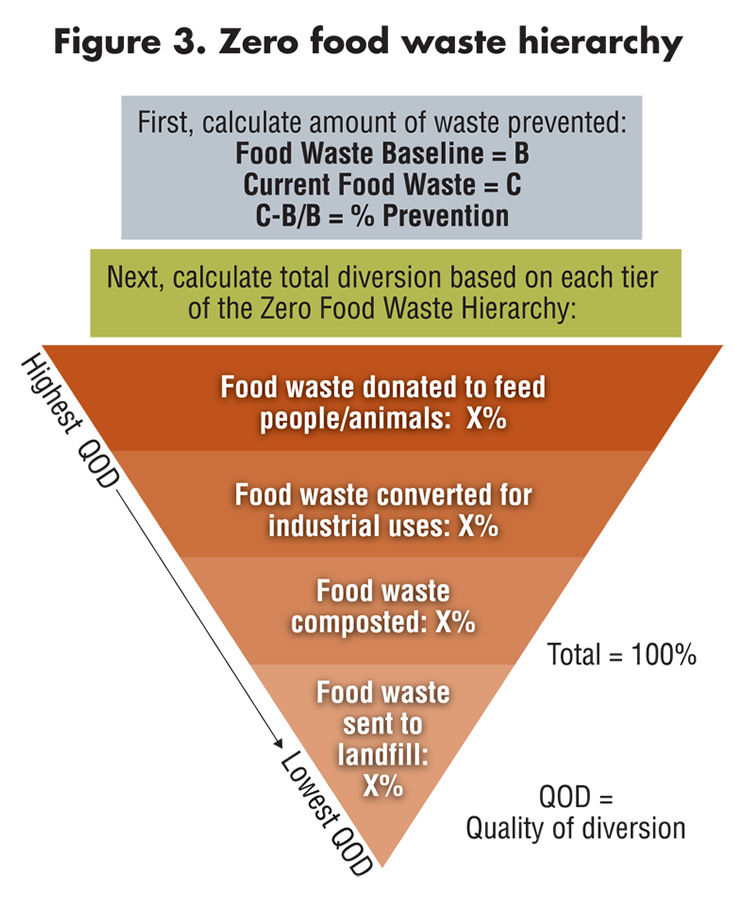
Figure 3. Zero food waste hierarchy
3. Recommit to the Idea of Zero
The Zero Waste International Alliance (zwia.org) defines zero waste as “designing and managing products and processes to systematically avoid and eliminate the volume and toxicity of waste and materials, conserve and recover all resources, and not burn or bury them.” They also describe a success indicator that “businesses that achieve over 90 percent diversion of waste from landfills and incinerators are considered to be successful in achieving Zero Waste.”
I have tremendous respect for ZWIA and the full complexity of what they communicate about this issue (see “Get Zero Waste Certified,” July 2013). They provide an important leadership voice that has expanded industry understanding of this topic. Unfortunately, many users of this information have jumped to the success measure language and concluded that 90 percent diversion is good enough to claim “zero waste.”
There may be good thought behind setting a 90 percent threshold given the steep-to-impossible challenge of achieving 100 percent diversion. But sometimes the difficulty of the challenge is an important part of the journey. For this reason it’s time to commit to zero food service waste to landfill, in the context of an overall program involving measureable prevention efforts. Zero is zero. Ten percent is not zero.
The struggle for this final 10 percent represents an incredibly important and valuable part of the equation. Behavioral research has shown that if you tell someone they are an above-average performer in something (i.e. amount of exercise they undertake) they will often reduce their effort. But if you show someone they are better than average but not doing as well as others, they retain their focus and effort. They have a goal and a reason to persist. The concept of zero is important for this reason.
Zero waste should be something that we hold sacred, not a scorecard that we can fudge to make ourselves feel better. We need to keep the pressure on.
Looking Ahead
I challenge all of us working on zero food service waste initiatives to take a fresh look at how we use the term zero waste.
How much effort are we investing in prevention compared to our work on diversion? Prevention is often overlooked because it’s not as visible as diversion, but it’s clearly the most important thing we can be doing to combat food service waste.
You may not be able to “see” prevention, but you can measure it. I would encourage zero waste practitioners to begin measuring food service waste streams in much greater detail and on a regular if not daily basis. While ongoing measurement of food service waste may sound like a daunting task, I’ve spent ten years watching operators measure all preconsumer food waste on a daily basis at an item-by-item level, all without adding extra labor. By doing so they have reduced their preconsumer food waste by anywhere from 50 to 80 percent from their baseline waste generation levels. This happens because the data helps drive changes, but it also occurs because the very process of measuring waste raises staff awareness and leads to subtle behavior adjustments that add up over time.
Beyond using measurement as a mechanism to focus on prevention, consider adopting a 100 percent standard for zero waste in place of 90 percent. And try to report on your diversion efforts at each tier of the Zero Waste Hierarchy, so you can be sure you are maximizing the value and impact of your diversion.
Each of these steps will move us along the zero waste journey to a place much closer to the ideals of the concept. We want to consciously eliminate any shortcuts because this work is simply too important to aim for any less than our best.
Andrew Shakman is a food waste prevention advocate and the CEO of LeanPath, a food service technology company based in Portland, Oregon. LeanPath created the industry’s first automated food waste measurement system, which today combines scales, cameras and user input to fully quantify and characterize preconsumer food waste streams on a daily basis. In 2012, Andrew was named one of Food service Director Magazine’s “20 Most Influential” people in the food service industry. He is a coauthor of the textbook Greening Food and Beverage Services.