Add line about tables in print version
Columbia University’s Earth Engineering Center surveyed the 50 states in 2013 to measure tons of MSW disposed, combusted, recycled and composted in the U.S.
Nickolas J. Themelis and Ljupka Arsova
BioCycle February 2015
From 2002-2010, BioCycle and the Earth Engineering Center (EEC) of Columbia University conducted a biannual survey on municipal solid waste (MSW) generation and disposition in the U.S., called State of Garbage in America (SOG). In 2013, Columbia University conducted its own national survey and, similar to BioCycle’s SOG, it was based on data provided by the waste management agencies of the 50 states. The survey results (Chin, 2013) showed that the U.S. generated a total of 389 million tons of MSW, corresponding to a per capita generation of 1.3 short tons of MSW. Of the total waste generated, 22.6 percent was recycled, 6.3 percent composted, 7.6 percent combusted in waste-to-energy (WTE) facilities, and 63.5 percent was landfilled.
National composting statistics are hard to capture due to the lack of policies requiring data collection from composting facilities. It is tougher to account for the MSW composted than recycled since throughput at many small-scale composting facilities is not captured by states that do collect large-scale composting data. In particular, tons of MSW composted at institutional facilities are largely unknown by the states╒ solid waste management agencies.
Considering that 28 percent of the MSW generated in the U.S. is comprised of food waste and yard trimmings (EPA, 2012) that are amenable to composting, the 6.3 percent figure reported to the Columbia Survey appeared to be low. Therefore, a follow-up study — utilizing 2011 data where available — was undertaken by the authors to gain a better insight on the actual tons of MSW diverted to composting in the U.S.
2011 Composting Data
The composting section of the Columbia Survey questionnaire asked for the number of communities with curbside collection of yard trimmings and/or food waste; number of aerobic composting and anaerobic digestion facilities in state; tonnages of the curbside collected organic waste composted; and amount of organics composted at institutional facilities (schools, hospitals, and prisons).
A total of nine states, representing about 13 percent of the U.S. population, did not participate in the 2013 survey: three states (Alaska, Oklahoma and Virginia) did not have the required data and six (Hawaii, Louisiana, Michigan, Missouri, South Carolina and West Virginia) did not provide information in a timely manner to be included. For these nine states, data from the 2010 BioCycle SOG survey (Van Haaren et al., 2010), based on 2008 survey data, were used, and adjusted for 2008-2011 population growth.
Eleven states reported data for yard trimmings and food wastes separately, six states combined the numbers for the two streams, and the rest provided only the amount of yard trimmings composted. Eight states (Arkansas, Delaware, Kansas, Kentucky, North Carolina, North Dakota, Rhode Island, Wyoming) and Washington, D.C. stated that only yard trimmings are collected for composting. Nearly all states reported tonnages that were delivered to composting facilities. California, Washington and Minnesota reported the largest number of curbside collection programs for compostables. Other states, like New York, operate some community drop-off programs for composting.
Anaerobic digestion (AD) of the organic fraction of the MSW in the U.S. in dedicated plants is still in its infancy. However, some shredded food wastes are codigested in wastewater treatment facilities and farm digesters. The Columbia Survey requested information on the number of AD facilities in each state. California, Delaware and New York reported one, two, and three AD plants, respectively; seven states (Massachusetts, Mississippi, North Carolina, Ohio, Tennessee, Vermont, Washington) indicated that there were in-state AD facilities but did not report the number of plants or the amount of organics processed by AD.
Survey Findings
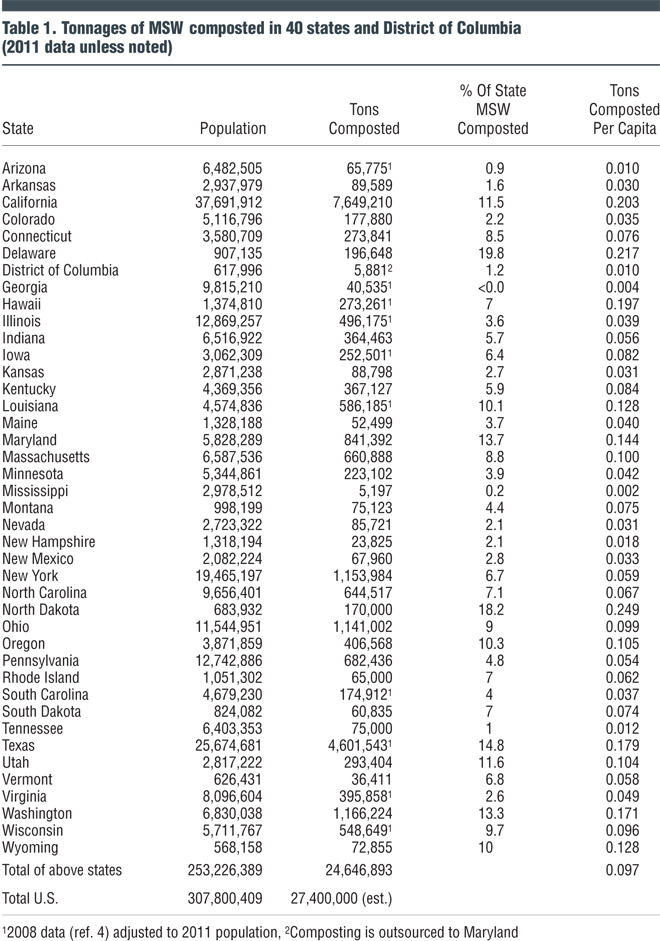
Table 1 presents the results of the Columbia Survey regarding composting activities in the U.S. Thirty two states and the District of Columbia provided their composting data for 2011. For another nine states where composting data for 2011 were not available, data from the 2010 BioCycle SOG, were used, adjusted for population growth between 2008 and 2011. The rest of the states did not differentiate between recycling and composting data, both in the 2008 and 2011 surveys and therefore could not be included in Table 1. The average composting rate for the reporting states (population: 253 million) was 0.097 tons per capita; by state, the rate ranged from 0.01 (Arizona) to a high of 0.2 tons per capita (Delaware and North Dakota).
The states reported in Table 1 represented 82 percent of the U.S. population and composted a total of 24,646,893 tons; as noted earlier, on average, 0.097 short tons of organic wastes were composted per capita. By assuming that the nonreporting nine states composted at the rate of one-half of all the states reported in Table 1, i.e., 0.05 tons per capita, the estimated total tons composted in the U.S. in 2011 increases to 27.4 million tons.
In general, composting data is not readily available because composting facilities are not required by the states to report amount and type of waste processed. Also, some states reported difficulties in collecting data from registered large scale composting facilities. Only two states (Kansas and North Carolina) provided rough estimates of the amount of wastes composted at small institutional facilities such as schools and hospitals. However, many states reported that there are institutional or other small composting facilities that are not registered through the state.
Discussion Of Results
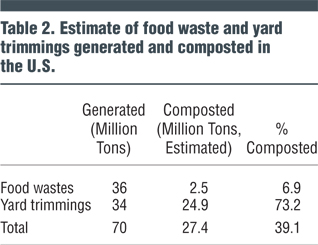
The U.S. EPA has estimated that 250 million tons of MSW are generated, and contain 13.5 percent yard trimmings and 14.5 percent food waste (EPA, 2012). Therefore, the yard trimmings amount to about 34 million tons and the food waste to 36 million tons. Of the total 70 million tons, 27.4 million are composted (39%), based on the findings of the Columbia Survey.
Another survey, conducted by the Institute for Local Self-Reliance and BioCycle, the State of Composting In The U.S., reported the total number of permitted composting facilities to be 4,914 in the U.S. (Platt et al., 2014). The main feedstock for these composting operations is yard trimmings; 71 percent of them are reported to compost only yard trimmings. Food waste is accepted for processing by 347 composting operations. However, a growing number of composting operations are upgrading their permits and infrastructure to process food waste.
Anaerobic digestion (AD) of food wastes in the MSW stream is an emerging technology in the U.S., despite the numerous AD plants in Europe and the U.S. experience with AD at wastewater treatment plants (WWTP) and farms. Part of the problem is the relative high capital cost of AD, in comparison to windrow composting of yard wastes (Arsova, 2010). However, interest in AD technology is growing because many states have set high landfill diversion goals that cannot be achieved without food waste diversion. Already, several states have implemented disposal bans on commercial food waste (Massachusetts, Connecticut, Vermont and Rhode Island).
Currently, there are around 20 stand-alone AD plants processing food waste in the U.S., with estimated total capacity of about one million tons per year; another 30 are under permitting or construction (GBB, 2014). Most of them process food waste from commercial generators and some residential food waste.
Of the 3,200 major WWTPs in the U.S., about 1,200 have AD facilities for treatment of biosolids (EPA CHP, 2011). However, only a handful of these plants codigest food waste. There is growing interest in using the excess capacity of these plants for processing food wastes. In addition, the AgSTAR program of the U.S. EPA reports that 44 out of the 244 farm-based AD plants codigest food waste (EPA AgSTAR, 2014).
Final Analysis
On the basis of the above discussion, it is estimated that the total amount of food waste currently collected and processed in the U.S. is as high as 2.5 million tons annually; therefore, the remainder of the 27.4 million tons that are composted, according to the Columbia Survey, must be yard trimmings. Table 2 puts the above numbers into perspective.
It is expected that, in the near future, composting of food wastes will increase since many state and local initiatives have been implemented to increase recycling, divert more materials from disposal, and target zero waste to landfills. A solid waste diversion rate of more than 50 percent cannot be achieved without including organics into the recycling efforts.
BioCycle has reported that the number of municipalities with curbside collection of residential food waste increased to 198 communities in 2014, representing 2.74 million households spread out over 19 states (Yepsen, 2015). Currently, more than ten municipalities have issued, or are in the process of developing, requests for proposals (RFP) for AD systems or alternative technologies for processing food wastes (GBB, 2014). In addition, more than ten AD projects are under development based on initiative of private companies. Most of these projects are in states with legislation in place supporting waste management projects, either at the state or local level.
Professor Nickolas Themelis is Director of Columbia’s Earth Engineering Center and Chair of the Global WTERT Council. Ljupka Arsova is a Consultant II at Gershman, Brickner & Bratton, Inc., Fairfax, VA and a specialist in composting technologies.