Goals of the test were to determine how particle sizing affects compost yields and quality, and plastic retrieval.
David Girard
BioCycle August 2018
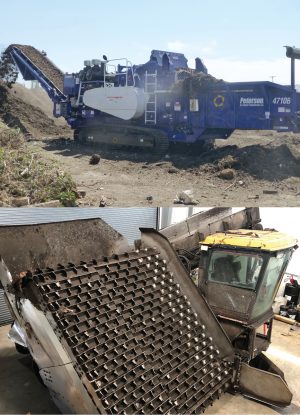
A Peterson Pacific horizontal grinder (top) was used to produce the 6-inch and 8-inch particle sizes for the field test. Dirt Hugger turns its windrows with a Vermeer elevated face turner (bottom).
How does particle sizing affect the composting process and more importantly affect the finished product? There isn’t much conclusive science to draw from, but there is a perception that material preprocessing ahead of composting is a necessary evil and with aerated static pile composting — being used at a number of facilities accepting food waste — less processing may be better. Peterson Pacific Corporation decided to conduct a pilot test to study particle sizing in order to offer better products and services for their customers.
The goals of the test were to determine how particle sizing affects compost yields and quality, and plastic retrieval. Questions posed prior to the test included:
• Are large pieces of carbon good for compost and is leaving plastic in larger pieces beneficial for mechanical separation and removal?
• Coarse carbon does help pile porosity but are large pieces (generally >10 inches) better than carbon reduced to a mix of 2-inch to 6-inch particle sizes?
• If the carbon and plastic are processed to a smaller particle size, will small pieces of plastic end up in the finished compost?
• Is there a particle size range for plastic film that allows removal at a higher rate through conventional air separation equipment?
Test Results — Composting
The field test was performed at the Dirt Hugger composting facility in Dallesport, Washington from August 15, 2017 to November 7, 2017. The facility is located in the Columbia River Gorge near The Dalles, Oregon. The summer weather in this area is very dry with strong winds. (Links to previous BioCycle articles about Dirt Hugger in the online edition of this article.)
Dirt Hugger composts yard trimmings and food waste from several regional transfer stations. Feedstocks have a fair amount of plastic. This facility does not own a grinder and therefore does not pregrind/process the incoming material. Approximately 30 percent is preprocessed at the originating transfer facilities to save trucking expense. The balance is unprocessed material of which the largest percentage is curbside-collected source separated organics (yard trimmings and food waste). Thus it contains a high amount of material that is one-inches and under in size. The Dirt Hugger facility was chosen for the field trial because the feedstocks composted there most closely represent the oversized product that is common with slow speed grinders.
The facility utilizes a turned aerated pile system; the rows are turned approximately 15 times during stage one composting (14 day period). Positive aeration is utilized on the stage one pad. During stage two the material is turned regularly (more than 10 times) but the pad is not aerated. The piles are turned using a Vermeer CT1010 elevated face turner. The entire composting process takes 90 days.
Preparing The Windrows
August 11, 15 & 17, 2017
The field test incorporated two alternative particle size configurations (6 and 8 inches) throughout the total composting cycle. Three sections (rows) of an aerated static pile were created. The first row was a control based on the standard operating procedure at Dirt Hugger. The control contained a mix of 30 percent preprocessed and 70 percent unprocessed feedstock. The Dirt Hugger material was identified as the D.H. Control and was processed into its row on August 11, 2017.
The second portion of the test was identified in this report as Processed Rows, which included 2 different particle sizes. A Peterson Model 4710B 765 horsepower horizontal grinder with 6-inch hexagonal grates was utilized to process the previously unprocessed feedstock (the 70% portion). This material was put into a row on August 15. The third row was identical to the second but processed with 8-inch hexagonal grates and put into a row on August 17.
There are two important notes here. The first is that there was little visible and measurable difference between the material processed with the 6- and 8-inch grates, so after the Stage One composting was complete those rows were combined. The test then switched to two alternatives — D.H. Control and Processed Rows. The second is to note the 4 to 6 day difference in row creation dates had some impact on the final results.
Several observations were made after building the rows and prior to composting. The D.H. Control was coarser. The Processed Row had higher density from the additional preprocessing and was under the 1,000 lbs/cubic yard goal, suggesting it contained more product. The plastic differences were also evident. The D.H. Control had a majority of the plastic larger than 12 inches in at least one dimension (length and/or width). The Processed Rows had mostly smaller plastic and mostly in the 6-inch or smaller size class.
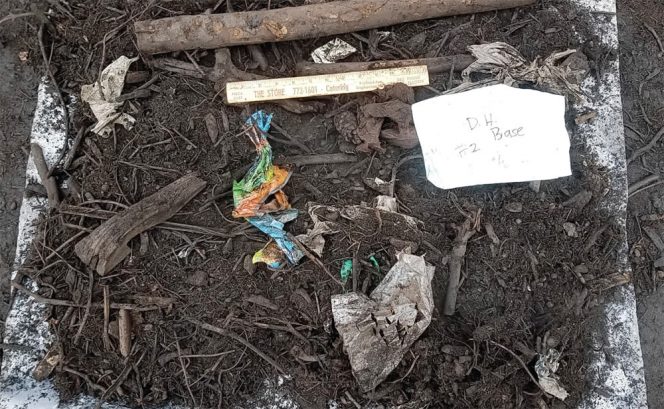
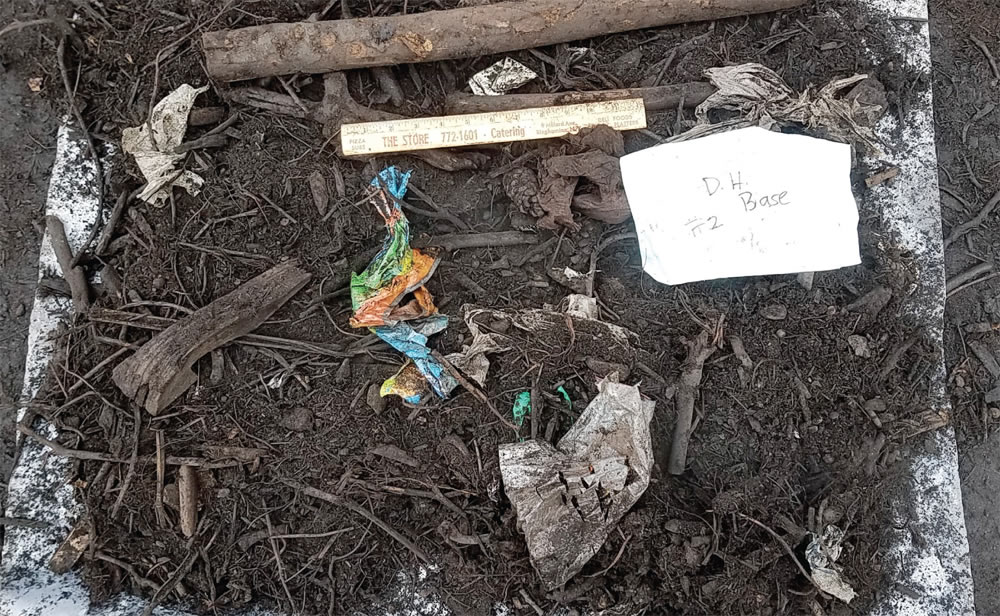
Hand-sorted 5-gallon samples: Samples were weighed and material hand separated into three sorts: plastics/ contaminants; product >1-inch in size and product Control on left and Processed Row material on the right.
Stage One Active Composting
August 11–17 to September 1
The material was processed on a positive forced aeration pad and turned regularly. The materials were moved to the Stage Two pad on August 31 and September 1. The D.H. Control was on the pad for 20 days and the Processed Rows were on the pad for 15 to 17 days. Both rows were sampled using a Solvita test and both had scores of 5 for both carbon dioxide and ammonia.
After Stage One composting, both materials were measured for density using the standard 5-gallon pail test (Table 1). The density was higher for the Processed Rows.
Both materials were also compared using a sieve analysis conducted at Dirt Hugger (Table 2). The Processed Rows had less product larger than five-eighth-inch and thus more fines. For this sieve analysis, large pieces were removed and not considered, as this would have skewed the results for the D.H. Control and make it seem slightly less coarse.
Conclusions after Stage One and prior to Stage Two composting included:
• Both products looked and smelled good, a visual and sensory assessment that the materials had composted effectively. The difference between the materials’ appearance in the windrows is quite significant. The D.H. Control was still significantly more coarse.
• Material processed with 6-inch and 8-inch grates prior to composting was almost identical, which suggests a viable operating strategy is to take advantage of the increased productivity and fuel savings of the larger opening grates.
• D.H. Control had a lot of plastic larger than 12-inches in at least one dimension. The plastic particle sizes were reduced in the fully processed windrows, generally in the 6-inch size class.
• Turner operator noted that the Processed Rows were much easier to turn with the Vermeer CT1010. He also observed reduced plugging of the elevated face turner from very large sticks.
Stage Two Composting — Curing
September 1 – November 6-7
All test material was moved to the curing pad for 68 days and turned regularly with the Vermeer CT1010. While both products looked like stabilized compost, there was still a very noticeable difference with more fines in the Processed Rows compost. The operator noted that the Processed Rows were easier on the turner, even on the curing pad, due, in part to the throwing action of the elevated face turner.
At the end of curing the D.H. Control tested at 6 for carbon dioxide and 5 for ammonia using a Solvita test; the Processed Rows tested at the same levels of maturity.
Test Results — End Products
Screening And Separation
November 6-7, 2017
Both the D. H. Control and Peterson Processed Row samples were reviewed and tested in several ways. The first was a visual inspection of both materials done at the pile. The Processed Rows appeared to have more fines. The second was the 5-gallon pail test. Samples were gathered, weighed and the material hand separated into three sorts: Plastics/contaminants; product greater than 1-inch in size and product less than 1-inch in size.
The hand-sorted samples of each product were weighed (Table 3). The results confirmed the visual inspection in that the Processed Rows had more fines and less material larger than 1-inch. The plastics sort yielded two observations: a lot of plastic can hide in even a small sample and approximately 90 percent of the plastic by volume had at least one dimension equaling 12 inches. The plastics removed were not weighed or measured due to a lack of a scale capable of measuring lightweight materials accurately.
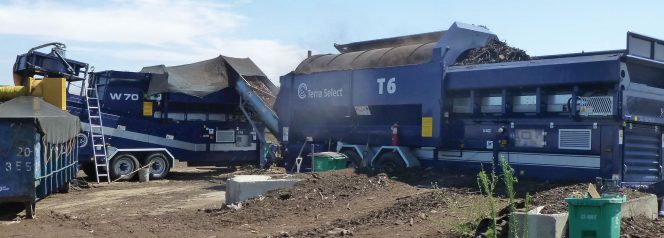
The second part of the screening and separation test measured the products coming out of a trommel with a three-eighth-inch opening punch plate drum, followed by an air separator (windsifter).
The second part of this screening test measured the products produced by the Terra Select T6 trommel with a three-eighth-inch opening punch plate drum and a Terra Select W70 Windsifter. Identical machine settings were used for all products.
For this test, 50 cubic yards (cy) were used for each sample, divided into ten 5-cy buckets each. The buckets fed to the trommel were counted and the buckets of end products (i.e., fines and overs) were measured. As this testing was done during normal operations at Dirt Hugger, it was not possible to do detailed weighing of each bucket of materials loaded and removed from the screen.
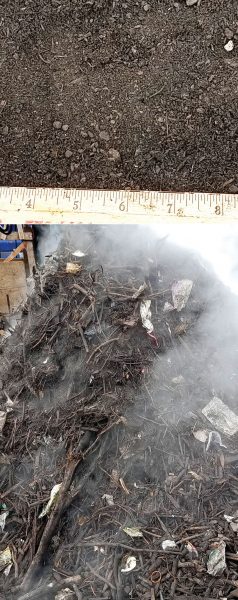
Screening and separation results: The D.H. Control product (fines top overs bottom) after the trommel and air separator. Most of the plastic is over 12 inches in at least one dimension (width and/or length).
The products were screened and the overs fed directly into the windsifter. The quality of the fines/accepts (i.e. sellable compost) were excellent for both the D.H. Control and Processed Rows (Table 4). There was no visible difference in the fines other than the Processed Rows appeared to have a slightly higher moisture content. There was, however, a significant visual difference with the overs. A greater percentage of the plastic was separated from the Processed Rows. For both products, the vast majority of plastic missed by the windsifter equaled 12 inches in at least one dimension, as large pieces of plastic are more likely to be weighed down by sticks and debris making them too heavy for the vacuum on the windsifter. For this test the larger material in the D.H. Control could have compounded this effect.
Analysis of the final products shows more salable fines/accepts from the Processed Rows. For this test, the fines-to-overs ratio was at least five basis points higher for the Processed Rows than the D.H. Control (Table 4).
Lab Analysis Of Products
Post Screening And Separation
Samples from both products were sent to the lab for full analysis. Both samples passed every parameter and the result was good quality compost (Table 5). Neither sample contained any inerts, indicating that processing the feedstocks and plastic to a smaller size did not push plastic into the finished compost. The results could vary with a significantly larger trommel screen opening.
The C:N ratios in Table 5 for the D.H. Control (12) versus Processed Rows (17) may be a result of not adequately modifying the initial recipe for the Processed Rows. The grinding increased the density of the feedstocks with food waste, thus the C:N ratio was higher in the batch with the ground material since there was more available carbon. A lesson learned is to take appropriate steps and do the lab analysis when making major modifications in particle sizing.
The moisture and maturity indicate a slightly less mature product for the
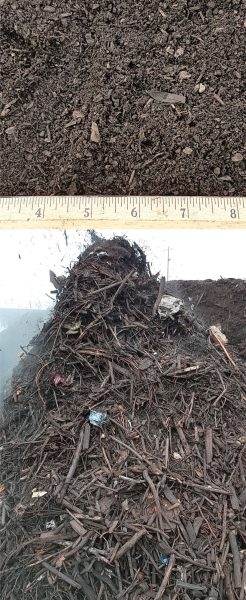
Screening and separation results: Peterson Processed Rows’ fines (top) and overs (bottom) after the trommel and air separator. Plastics content in the Processed Rows was lower than the D.H. Control. Note that the remaining plastic is mostly 12 inches in size.
Processed Rows. This is due to several factors: Processed Rows spent less time on the Stage One aerated composting pad, and the higher C:N ratio. It is likely the material in the Processed Rows could have benefitted from a few extra days on the Stage One pad, rather than a few less days.
Test Conclusions
Conclusions from this test included:
• The act of processing the material to a smaller particle size did not negatively impact the process (still made a salable product) but it did increase the quantity of Acceptable Compost.
• Compost operators have a potential prospect of improving their particle sizing to increase the ratio of finished compost.
• Increased yields and compost sales are worthwhile with even a modest increase in the salable compost.
For example, an improvement from a 50/50 split to a 55/45 split can provide potential income growth that could exceed $75,000 to $127,500 annually for a facility processing 50,000 tons/year. Table 6 is based on tonnage ahead of the screening process. A facility screening 100,000 tons of finished compost could realize a potential $255,000 income gain.
The field test indicates that it may be desirable to reduce plastic to less than 12 inches to facilitate removal with mechanical windsifters. Mechanical windsifters applied on the overs fraction appeared to do a poor job with larger pieces of plastics, especially 12 inches or larger. By far the greatest volume of film plastics that was missed for both samples was greater than 12 inches. It also appears that plastic downsizing (i.e., preprocessing in a grinder with the feedstocks) does not necessarily contaminate the compost. Further controlled studies are required to determine the optimum size or range of processed sizes of film plastic.
The processed material was easier on the equipment all through the process from the turner to the trommel and windsifter. Hard plastics were not studied. They were observed and counted but there is no data or indication how well the windsifter removed them. The W70 Windsifter has a destoner belt and it separated a small volume of this material. The overs pile contained some hard plastics.
Dave Girard is the Recycling Market Development Manager for Peterson Pacific Corporation in Eugene, OR. He can be reached at dave.girard@petersoncorp.com


