Sally Brown
BioCycle January 2019
I remember seeing cars with a big pink fake fur mustache and not having a clue what that was about. Now the logo has been changed, keeping the pink background with white letters to spell out Lyft. I can see the logo whenever I want just by looking at my phone. We are in the middle of a great upheaval, centered around how we get from place to place. For longer than I can remember the answer has been straightforward and simple: you drove your car. Knowing how to drive and then owning a car have been staples of the American culture. Just consider that symbol of status — the Cadillac.
Owning a car may be central to the American psyche but it is also central to carbon emissions stemming from both building the car and driving it. The carbon footprint for car construction ranges from 6 tons of CO2e for a tiny one to about 35 tons of CO2e for a fancy all-wheel drive model. According to the EPA, getting behind the wheel emits another 4.6 tons of CO2 per year (based on 22 miles per gallon and driving 11,500 miles per year). Not only does owning and driving a car produce carbon emissions, it also costs money. According to AAA, the annual cost of car ownership ranges from about $6, 350 for a small sedan to over $10,000 for a pick-up truck (about $16-$27/day). This includes purchase price, depreciation, repairs, insurance and gas.
Having a car is really convenient except when it is a pain. More often than not it is a pain in the city rather than on the open road. How often do you see car commercials with the vehicle of choice stuck in traffic in midtown? A car is a pain in a city when you can’t find a place to park, when it costs a fortune to park in a lot, and especially when you are stuck in traffic. It is a pain when it breaks and you have to pay for repairs. Even when you don’t have to pay for repairs, the purchase price, insurance costs and fuel costs are not cheap. Cities are a logical place then for alternatives to our dependence on cars.
Rise Of The TNC
In urban areas, transportation options are broadening and diversifying every day. Public transit is a fixture in many cities and even expanding in some. Light rail came to Seattle a few years back. Construction to expand the system is underway. There are a range of new options as well. We have Transportation Network Companies (TNCs), the two most famous being Lyft and Uber. These also offer options for shared rides. Car rental has expanded way beyond Hertz and Avis with a wide range of apps available so you can get BMWs by the hour. You can even make extra cash leasing your own car — the automobile version of Airbnb. If you want a blend of transport and fitness, a range of bike rental options are now available including ones with electric motors for those uphill climbs.
Each of these has the potential to reduce carbon emissions associated with cars. For that to be the result, however, several things have to fall into place. First is that people use these alternatives and don’t buy as many cars and don’t drive their own personal vehicles as much. And for that to happen, these alternatives have to add up in the convenience and reliability columns while still being sufficiently less expensive so that the savings really add up.
Right now, according to one report, the opposite is happening (Schaller, 2018). Business for TNCs like Lyft is booming. Total number of passengers transported in 2017 was up 37 percent from 2016 to 2.61 billion. This, in combination with traditional taxis, is expected to keep growing. The number of rides in TNCs and taxis are projected to exceed trips on public buses by 2018. The people that use TNCs are primarily my kids’ demographic, not mine. Most are in big cities, make more than $50,000, are between 25 and 34 years old, and well-educated, notes Schaller. Older, poorer and less well-educated people are missing the boat (or ride).
 Instead of these alternatives resulting in decreased car ownership and fewer overall vehicle miles travelled, the opposite has occurred. These rider services have added 5.7 billion miles of driving in 9 major metropolitan areas. For each mile of driving your own car, they have added 2.8 TNC miles. At the same time, car ownership is on the upswing in most U.S. cities. One might call the current state of affairs “gridlock.”
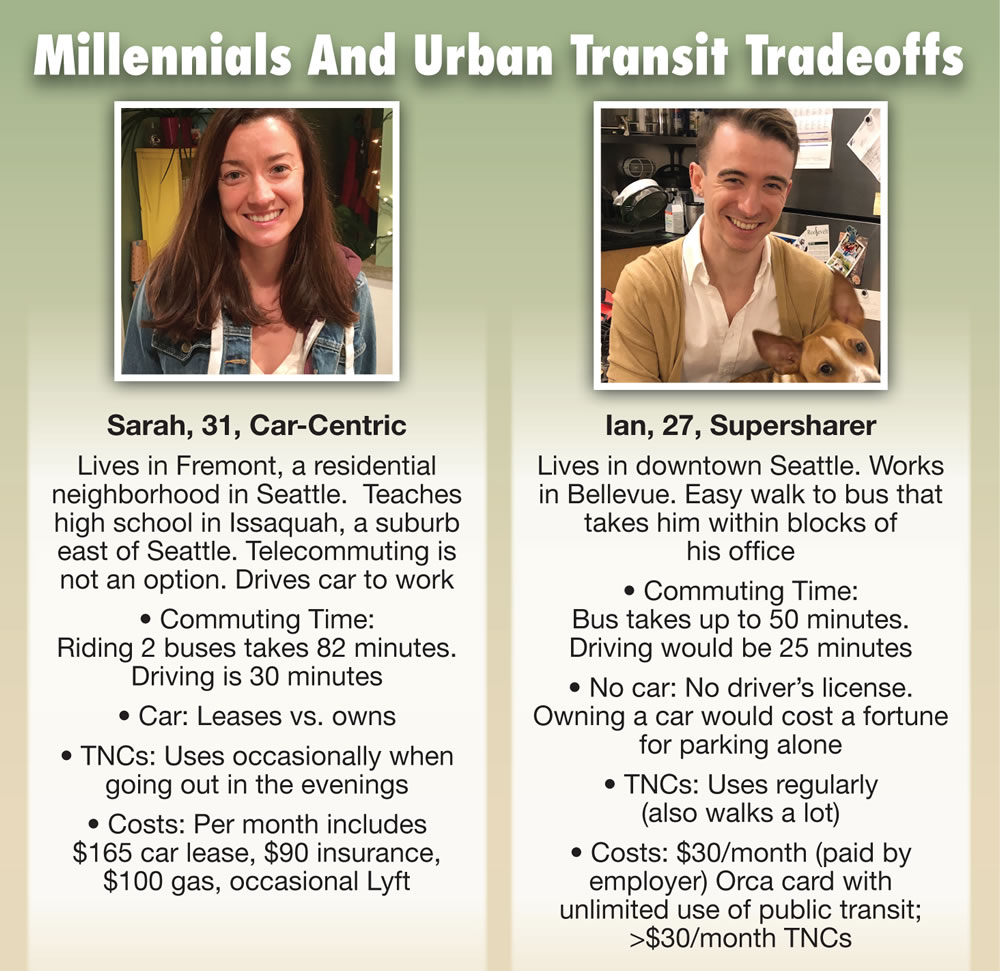
Supersharers
In order for this new revolution in urban transportation not to block the box, the balance has to change. A second report suggests that maybe this has started (Feigon and Murphy, 2016). The authors interviewed heavy users of TNCs in seven cities. They also talked to transportation officials, looked at capacity in both the public and private sectors, and considered the potential for partnerships between the two. This study identified a promising individual — the “supersharer.”
Supersharers depend on these new forms of transportation to augment their use of public transportation and as a result use half as many cars as people who use transit without the associated services. In fact, the researchers found that the shared services (their term to lump all of these new options together) typically complement public transport. A supersharer will take the bus to work and the Uber to the club. The report suggests that cooperation between the public and private sectors is a way to grow the population of supersharers.
Convenience And Cost
The question then becomes how to get this public private cooperation to grow. How can cities encourage people to use emerging transportation options, along with existing public transit and simultaneously get them to rely less on personal vehicles? The most critical thing to consider is convenience. People won’t get out of their cars for a much less convenient alternative.
Then comes cost. By making driving in urban areas more expensive and alternatives the appropriate mix of convenient and affordable, you have a sure thing. To do this requires developing a complicated and integrated system that melds multiple options. Ride share services need to complement public transportation and not serve as a substitute for taking the bus. Availability of ride share vehicles could be regulated to reduce volume during peak travel periods where excess vehicles result in more congested roadways.
A draft report from San Francisco suggests that working with the city government to conduct pilot studies is an excellent start. This helps to provide the data on the best place in the mobility chain for different transportation options. It also provides the city with data on how to best integrate these services with existing transit options. As I was writing this an email from the mayor of Seattle popped into my inbox. Like that woman was reading my mind. The email announced a new program where the city is going to operate its own TNC. If you live in West Seattle (a part of the city that is not very densely population) ride2 will pick you up and take you to a transit center so you can get on the bus or ferry.
This urban transportation revolution that we are in the middle of has the potential to make cities a much nicer place to live — for all demographics. It also has the potential to make cities even more congested than they already are. Right now, we are not sure how to steer the chaos in the right direction. Even Google maps isn’t sure. And this is before the added complexity of self-driving cars is thrown into the mix. Fasten your seat belts everybody.
Sally Brown is is a Research Associate Professor at the University of Washington in Seattle (slb@uw.edu) and a member of BioCycle’s Editorial Board.
References
Feigon, S. and C. Murphy. 2016. Shared mobility and the transformation of public transit. National Academies Press.
Schaller, B. 2018. The new automobility: Lyft, Uber and the future of American cities.
San Francisco County Transportation Authority. 2018 Emerging mobility evaluation report: Evaluating emerging mobility services and technologies in San Francisco Draft Report.