B. Morelli, S. Cashman, C. Ma, J. Turgeon, and J. Garland
Throughout Massachusetts, anaerobic digestion (AD) facilities, municipal composting programs, and farm-based composters and digesters are working to divert food waste from landfills and waste-to-energy (WTE) facilities. The pace of this work increased in 2014 with passage of the state’s organic waste ban. Research initiated by U.S. EPA and Eastern Research Group studied the relative environmental impacts and economic costs of select food waste recycling and disposal options in Massachusetts. While the pathways modeled here are specific to Massachusetts, the comparative systems level analysis framework could be applied to other communities trying to determine the environmentally preferable and cost-effective management option(s).
This article provides a summary of the study’s findings. A detailed technical presentation of this project’s methods, assumptions and results is available in a publicly accessible EPA report (Morelli, Cashman, et al., 2019). An appendix table summarizes the most essential assumptions used to generate study results.
This study compares the environmental and economic impact of recycling 1 kilogram (2.2 lbs) of typical commercial food waste (e.g. fruit, vegetable, meal scraps) through either codigestion at a wastewater treatment facility (WWTF) or composting. The recycling options are compared against common disposal pathways — landfill and WTE incineration — using life cycle assessment (LCA) and life cycle cost analysis (LCCA) methods. The impacts are quantified in eight environmental categories covering global and regional impacts as well as life cycle costs (reported as net present value). The global warming potential (GWP) results are characterized using factors reported by the Intergovernmental Panel on Climate Change (IPCC) in 2013 with a 100-year time horizon. Considering multiple indicators can help decision-makers choose the most environmentally preferable option while minimizing tradeoffs and overall cost.
Modeling Assumptions
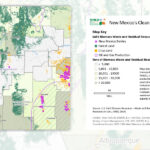
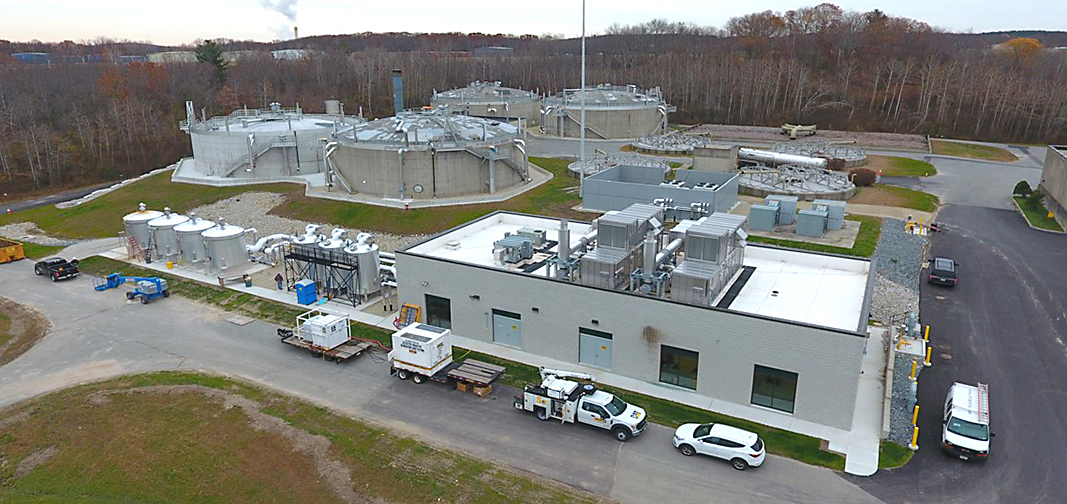
The codigestion option is based on data from the Greater Lawrence Sanitary District’s (GLSD’s) WWTF in North Andover. At the time of this study (2018-2019), the WWTF was completing a capital investment project to expand existing AD capacity and install a 3.2-megawatt combined heat and power (CHP) system. Acceptance of food waste (bioslurry) for codigestion was ramping up in spring 2019. When operating at 100% capacity, the resource recovery project at the WWTF will be able to handle about 40% of Massachusetts’ available food waste volume. Because the AD expansion had not reached full-scale implementation at the time of the study, the GLSD life cycle model is supplemented with an estimate of the expansion’s associated operational changes, based on data developed using the GPS-X™ wastewater process model (Hydromantis, 2017).
The composting analysis is based on literature data and correspondence with local facilities in Massachusetts (Komilis and Ham, 2004; ROU, 2007; Boldrin, Andersen, et al., 2009). Both windrow and aerated static pile (ASP) composting methods are assessed as food waste recycling options. Windrow composting is the most common method in Massachusetts, based on our assessment of facilities in the eastern half of the state. ASP systems are less common, but at least one Massachusetts facility that accepts diverted food waste uses this method. ASP systems can eliminate or mitigate compost methane emissions by using a biofilter (SYLVIS, 2011). The compost systems modeled are relatively simple implementations without advanced emissions controls for VOC and ammonia emissions.
The landfill and WTE scenarios are modeled using the Municipal Solid Waste Decision Support Tool with parameters set to local conditions and assuming the same starting food waste composition as the codigestion and composting scenarios (RTI International, 2012). Modeled landfill gas management reflects current practice in Massachusetts, where 19% of gas is flared and 81% is used for energy recovery. The EPA report on this study presents results for a national landfill management scenario where 24% of landfill gas is flared, 68% is used for energy recovery and 8% is vented to the atmosphere.
Environmental And Cost Factors
Figure 1 is a simplified diagram of GLSD’s AD food waste recycling system and the four alternative food waste recycling and disposal options. Avoided product flows contribute credits (reductions) to the environmental impact of each treatment option. For example, environmental credits are given to systems that coproduce electricity or displace the need for commercial fertilizer by land applying products derived from food waste. Onsite process and combustion emissions are reflected in the life cycle inventory data as appropriate. Each of the five systems has input flows — energy, chemicals, infrastructure, and transportation — that contribute to environmental impact and operational cost.
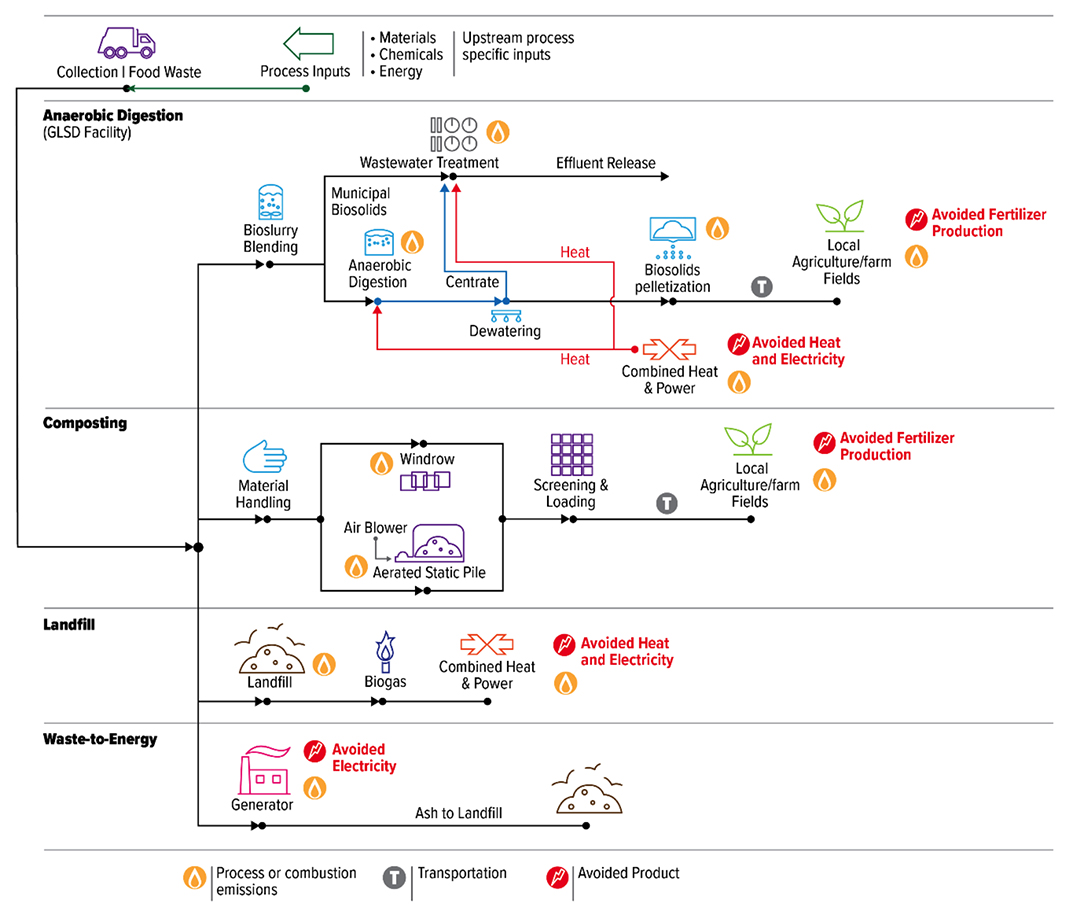
Figure 1. System diagram of five food waste recycling and disposal systems: anaerobic digestions, windrow composting, aerated static pile composting, landfill and waste-to-energy incineration.
Environmental and cost results are specific to the food waste processed at each of the five facility types. For the GLSD WWTF, environmental burdens for the share of unit process operations attributable to food waste are included, excluding operations related to the management of municipal sewage. Likewise, environmental credits were assigned only to the portion of CHP energy production attributable to food waste. Environmental benefits of avoided energy production are based on the net release of combustion emissions and the shift from fossil to biobased energy sources. The same general approach was applied to other disposal options. For composting and landfill disposal, the analysis includes only greenhouse gas (GHG) emissions attributable to food waste (i.e. not yard trimmings or MSW). This was done to provide the fairest possible comparison between a diverse set of end-of-life recovery and disposal options.
This study, like all LCA studies, estimates the environmental impact of specific system configurations and operational parameters and will not be representative of all situations. A sensitivity analysis is presented to capture potential variability in AD and composting system performance and compost transport distance.
However, several key factors are expected to vary across regions in the U.S., including:
- Technology selection (e.g. biosolids pelletization, CHP and WTE efficiency/emissions and landfill performance)
- Climate and management effects on composting performance, which have been shown to have a large effect on pile GHG emissions (Horwath, Barker, et al., 2015)
- Transport assumptions and fleet efficiency
- Regional electricity fuel mix, which impacts the benefit of avoiding grid electricity
Results
LCA results are presented for eight environmental indicator categories, including detailed GWP results. The five food waste disposal options are all closely linked to a broad range of environmental issues, through diverse emissions to air, land and water, chemical and energy inputs, and their potential to produce beneficial outputs. Landfilling, for example, is linked to climate change through the formation and release of methane. Anaerobic digestion and composting also have the potential for fugitive methane emissions, and to confidently choose between these options their emissions should be quantified, and their impact potential estimated.
Additionally, codigestion has the potential to increase nutrient discharges at the WWTF, while landfilling and WTE combustion generally release fewer nutrients to water resources. Considering multiple results categories is therefore essential. Focusing too narrowly on any one or two categories has the potential to exacerbate other environmental problems. LCA cannot eliminate such environmental trade-offs, but it can inform a thoughtful decision and identify areas for possible management.
Global Warming Potential
Figure 2 presents detailed results for GWP for the five food waste recycling/disposal options, breaking out impacts according to the processes that contribute GHG emissions. The figure confirms that AD, both composting methods, and WTE considerably reduce food waste disposal’s GWP impacts, relative to landfilling. This benefit is attributable to avoiding landfill methane emissions, which are a common impetus for waste disposal bans. Still, fugitive methane is the main GHG contributing to unit process emissions for AD, composting and landfill treatment options.
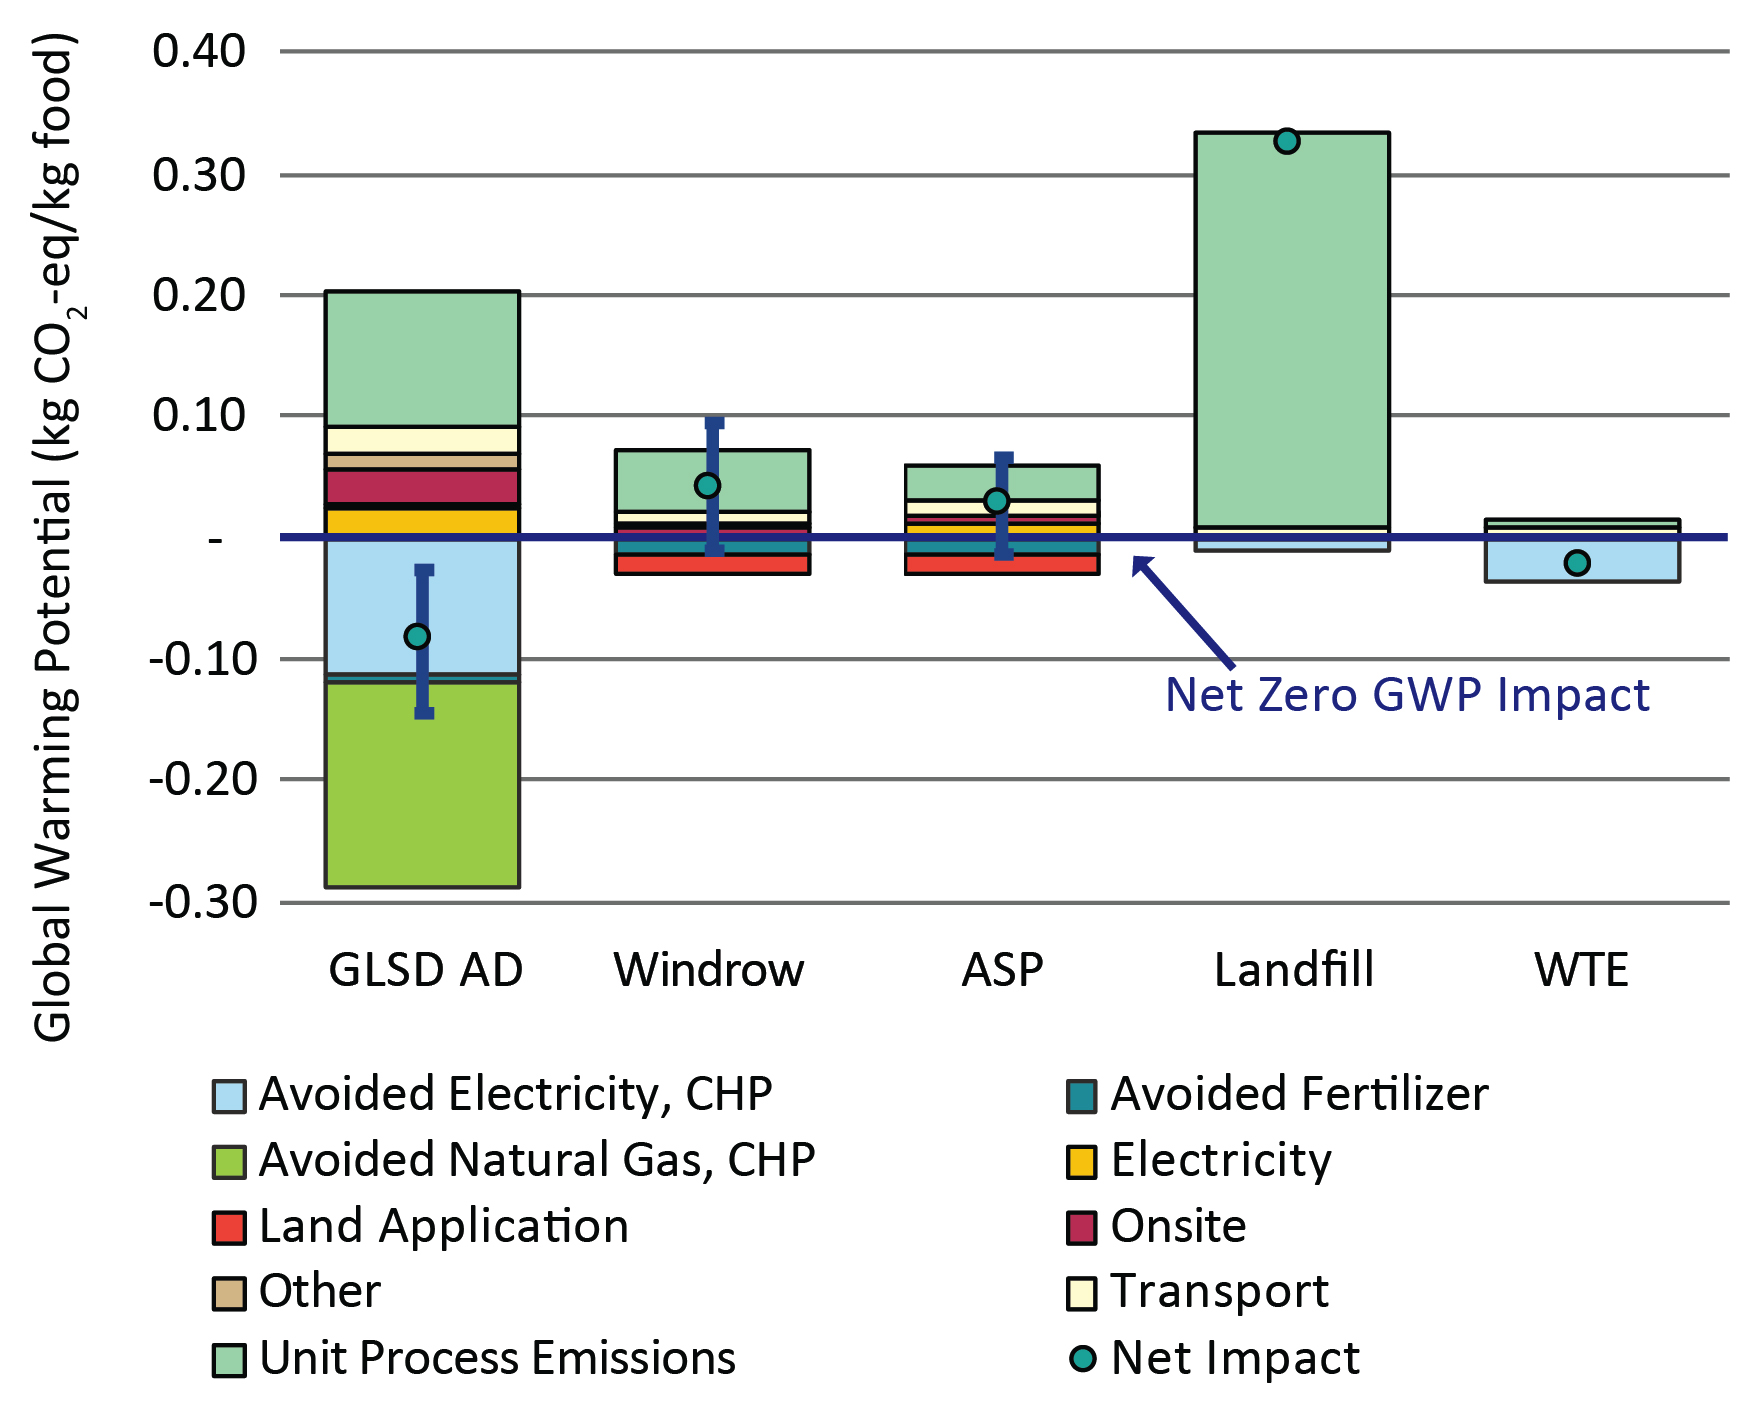
Figure 2. Global warming potential results for five food waste recycling and disposal systems. Error bars represent a low and high range of estimated impact potential.
AD: anaerobic digestion, ASP: aerated static pile; CHP: combined heat and power; GWP: global warming potential; WTE: waste-to-energy
Environmental credits are shown below the x-axis, contributing to reduced environmental impacts or even net environmental benefits. Biogas recovery avoids onsite natural gas burning and fossil energy consumption in the New England electrical grid leading to considerable net negative GWP impact for the GLSD AD. Uncertainty ranges for the AD and composting systems are based on scenario analysis that varies AD performance and composting GHG emissions (see appendix table).
Comparative Summary Results
Figure 3 shows comparative summary results for each of the five recycling/disposal options in all results categories. The figure includes cost results for the three recycling options, but not for landfilling and WTE (which are no longer relevant disposal options for commercial food waste in Massachusetts).
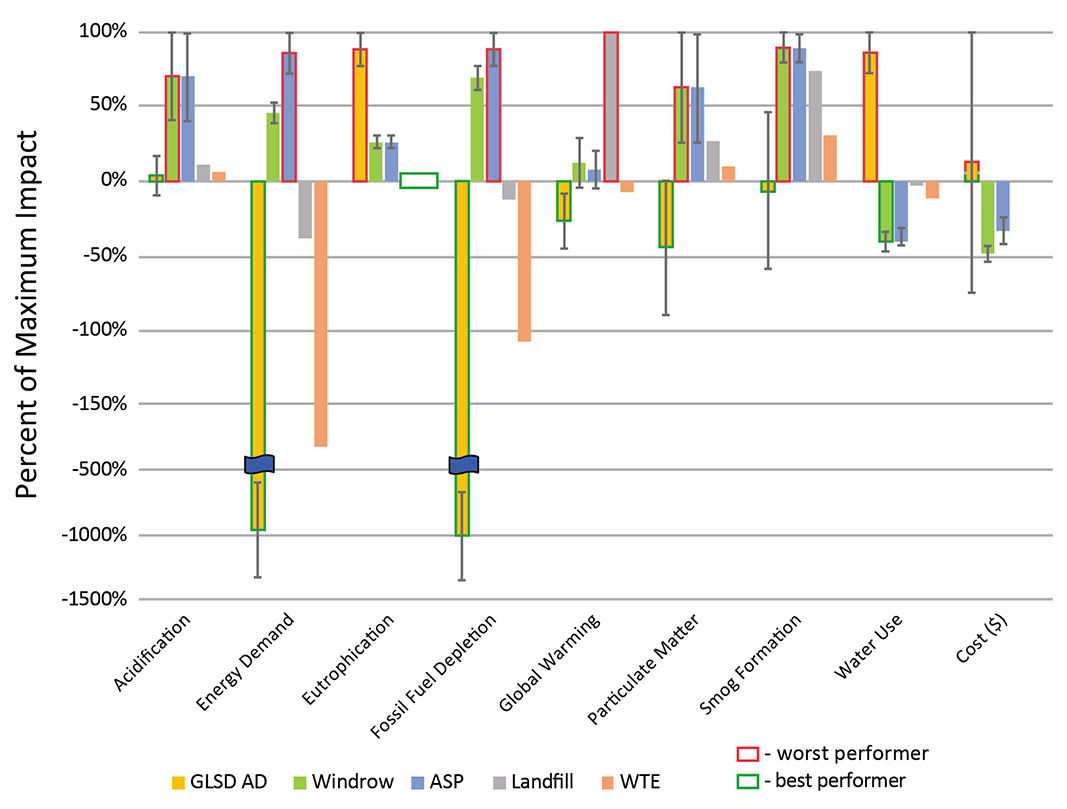
Figure 3. Summary LCA and cost results. Bar height represents average net impact potential for each treatment option as a percentage of maximum impact. Error bars mark high and low estimates of relative impact based on AD performance scenarios and compost process emission scenarios.
AD: anaerobic digestion, ASP: aerated static pile; WTE: waste-to-energy
Part II of this article takes a closer look at the results for the following impacts: sulfur dioxide emissions, eutrophication potential, energy demand and recovery, water use, acidification and particulate matter formation potential, and life cycle costs.
Ben Morelli and Sarah Cashman are with Eastern Research Group, Inc. Cissy Ma and Jay Garland are with the U.S. Environmental Protection Agency (EPA), Office of Research and Development , and Jason Turgeon U.S. EPA Region 1.
Appendix (pdf)
Image: Greater Lawrence Sanitary District (GLSD) anaerobic digesters, courtesy GLSD