Using various combinations, from reduction and recovery to composting and AD, the four New England states with organics disposal bans are advancing toward their capacity goals. Part II
Carol Adaire Jones
BioCycle November 2017
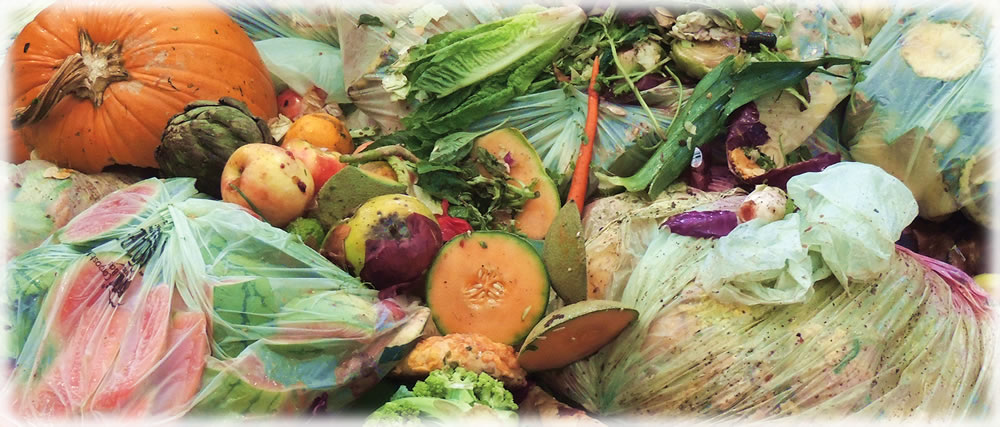
Photo by Doug Pinkerton
Part I of this two-part article, “Organics Disposal Bans And Processing Infrastructure” (Sept. 2017), provided a demographic, economic and solid waste profile for the four New England states with organic waste landfill disposal bans. Part II highlights the progress that the four states have made in developing their organics processing infrastructure, along with key state policies that complement the bans to promote facility development.
To recap, organics disposal bans went into effect in 2014 for Vermont, Connecticut and Massachusetts, and in 2016 for Rhode Island. The size thresholds of generators covered by the bans decline over time (except in Massachusetts), achieving maximum coverage of these generators in 2018 (Rhode Island) and 2020 (Connecticut, Vermont). The laws in Connecticut, Rhode Island and Vermont include a waiver of coverage if there is no processing facility permitted by the state within 15 or 20 miles of the generator. Distance exemptions expire in 2020 in Vermont, but have no expiration date in Rhode Island and Connecticut. Based on those exemptions, state officials in Rhode Island and Connecticut characterize ban enforcement as triggered by the processing capacity of facilities. When permitted facilities indicate they could accommodate more food waste feedstock, the state will notify generators in the covered area regarding their responsibility to divert food waste.
Since the bans came into effect, all four states have advanced toward their processing capacity goals. Population density influences the types of facilities sited in an area. Stand-alone anaerobic digestion (AD) facilities or wastewater resource recovery facility (WRRF)-based digesters tend to be located to serve densely populated areas due to substantial economies of scale. Rural areas are typically served by composting and smaller farm-based digesters. Commercial composting and farm-based digesters may also scale up to serve more urban areas as well.
Facility Development
Along with regional firms, some national and international developers have been attracted to the opportunities to build large facilities in Connecticut, Massachusetts and Rhode Island due to those states’ high population densities, high tip fees and electricity costs, and strong environmental policies, including the landfill bans. In Vermont, farm-based operations are more attractive due to low population densities and resulting diseconomies of scale, as well as the small quantity of additional capacity needed to fulfill the recycling mandate.
The states’ abilities to realize the potential of these landfill bans to expand organics processing capacity critically depend on the strength of a broader set of policies including: (a) updated solid waste regulations, b) policies to support markets in renewable energy and soil amendments end products, and c) financial and technical assistance.
All four states have revised their solid waste regulations to facilitate permitting of composting and AD facilities, though the elements included in the regulations vary. For example, neither Connecticut nor Rhode Island has a standard for codigestion of food waste at WRRFs. Permitting of stand-alone digesters has taken longer than expected in both states, delaying facilities coming online past the effective date of the bans. Developers and state officials have characterized permitting the initial facilities as a learning process, and attributed delays to the new and complex regulatory regimes, staffing constraints, and changes in technology choices during the permitting process. Rhode Island also cites the fact that its regulations (finalized in 2016) were being promulgated at the same time as the agency was reviewing the permit applications.
All four states also have developed various programs to support AD energy markets. Of particular note, all have Renewable Portfolio Standards (RPS) that cover electricity generated by AD and programs to support facility access to renewable energy credits (RECs). However, Amy McCrae Kessler of Turning Earth, which will be constructing an AD-composting facility in Connecticut, indicated that access to long-term renewable energy power purchase agreements for anaerobic digestion can be disadvantaged relative to solar, wind, and fuel cells.
“Many of the legislative and regulatory tools intended to help incentivize deployment of renewable energy facilities are drafted using vocabulary and metrics that do not fully capture the value and operational advantages of AD projects, including the environmental benefits,” explains McCrae Kessler. “For example, many solicitations for Class 1 renewable long term power purchase agreements are drafted for 10 MW to 20 MW projects, automatically excluding AD projects which are typically in the 1-3 MW range. When you take capacity factor into account, a 10 MW solar project operating at the standard 25 percent capacity factor generates the same amount of kWh as a 1.4 MW AD project operating at standard 95 percent capacity factor. They are equivalent in terms of energy output, with AD providing additional environmental and grid stability benefits, yet it is arbitrarily excluded.”
The levels of state agency staff and resources available to provide financial and technical assistance vary substantially across the states. Massachusetts has been able to deliver the most extensive program by tapping special funds set up through renewable energy programs, including targeted grants and loans and a technical assistance program for businesses and communities. Connecticut has provided Green Bank loans to AD developers, but only has one staff person spending quarter-time doing outreach and technical assistance for large generators. The state now relies on the Massachusetts-based contractor, Center for EcoTechnology, to provide assistance funded by external grants. In Vermont, agency staff provide outreach and technical assistance, and the Clean Energy Development Fund has provided small grants for 2 pilots. Rhode Island does not have the financial or staff resources to provide technical or financial assistance; only one-quarter of a staff person’s time is available to cover all recycling in the state.
Table 1 provides a food waste profile and processing capacity — both AD and composting — for each of the four states. More information on each state follows.
Massachusetts
Massachusetts, the largest state of the four by population (6.8 million), generates an estimated 1 million tons/year (tpy) of food waste. Even prior to the ban taking effect in 2014, the state made substantial progress in adding permitted organics processing capacity. Starting from a base in 2011 of 23 permitted facilities with about 100,000 tpy of capacity, by 2014, Massachusetts had added an additional 120,000 tpy of permitted capacity — with 26 additional facilities receiving permits and ongoing facilities expanding the quantity of food waste accepted.
In 2014, the state articulated a goal of increasing diversion by an additional 350,000 tpy by 2020. Similar to the other three states, Massachusetts expects a share of diversion will come from on-site processing at generators’ establishments, wasted food donations, and animal feeding operations. Working in collaboration with the state Clean Energy Results Program (an interagency initiative launched in 2011 to promote clean energy, including AD at WRRFs), the state’s complementary goal was to add 50 megawatts (MW) of electricity from AD.
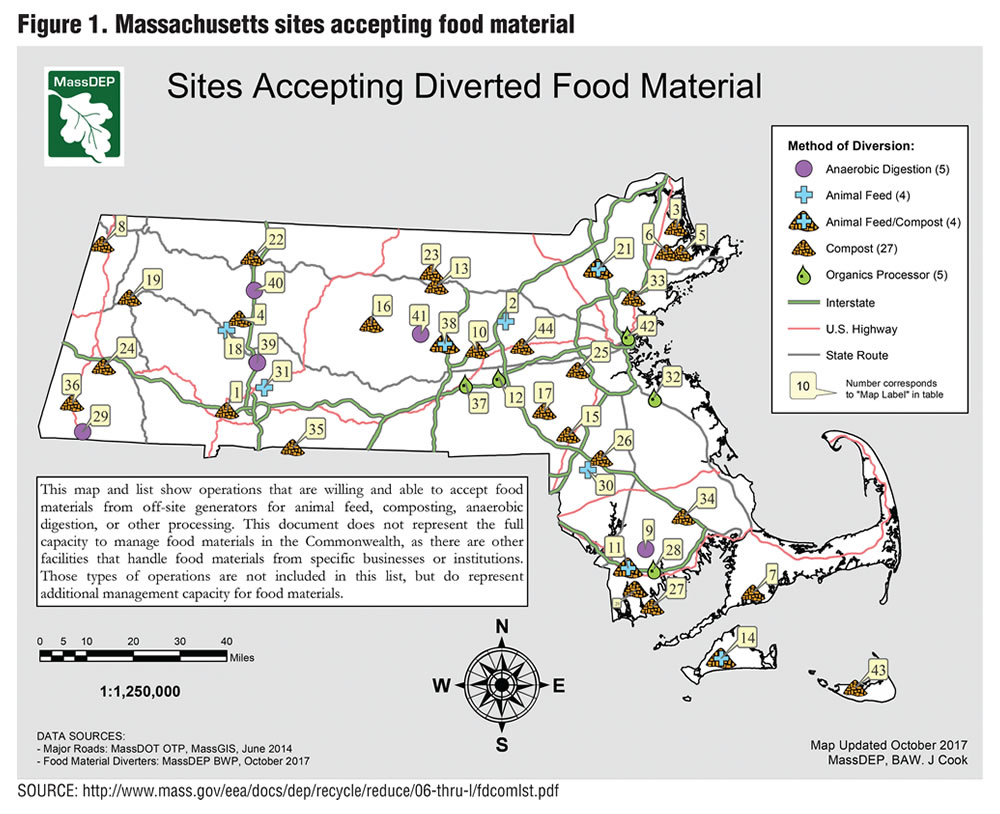
According to John Fischer of the Massachusetts Department of Environmental Protection (MassDEP), the state will exceed its food waste diversion goal, and current and future facilities will provide geographic coverage of the entire state. Between 2014 and 2017, the number of anaerobic digesters doubled from 4 to 8, providing 465,000 tpy of total capacity (Figure 1). This includes the largest new project, a fourth digester — built specifically for food waste at the Greater Lawrence Sanitation District WRRF — when it reaches full capacity in 2018.
In addition, there are four farm-based digesters that accept food waste in Massachusetts, three of which are owned and operated by the farm-based AD developer, Vanguard Renewables. Two stand-alone digesters are colocated with grocery stores (their exclusive feedstock suppliers), and a third is at the Greater New Bedford Regional Refuse District’s Crapo Hill landfill in Dartmouth. Four additional AD projects have been permitted and are in development, including three farm-based AD, along with the expansion of a WRRF-based facility.
In contrast, there has been flux in participation by composting facilities in food waste processing. Over the last 3 years, 4 plants have begun taking food waste, but 10 plants have stopped. Operators who exited have cited problems with odor and contamination. In addition to the contributions from composting and AD, substantially more than 50,000 tpy of diversion are coming from on-site processing, wasted food donations, and animal feed operations.
 Connecticut
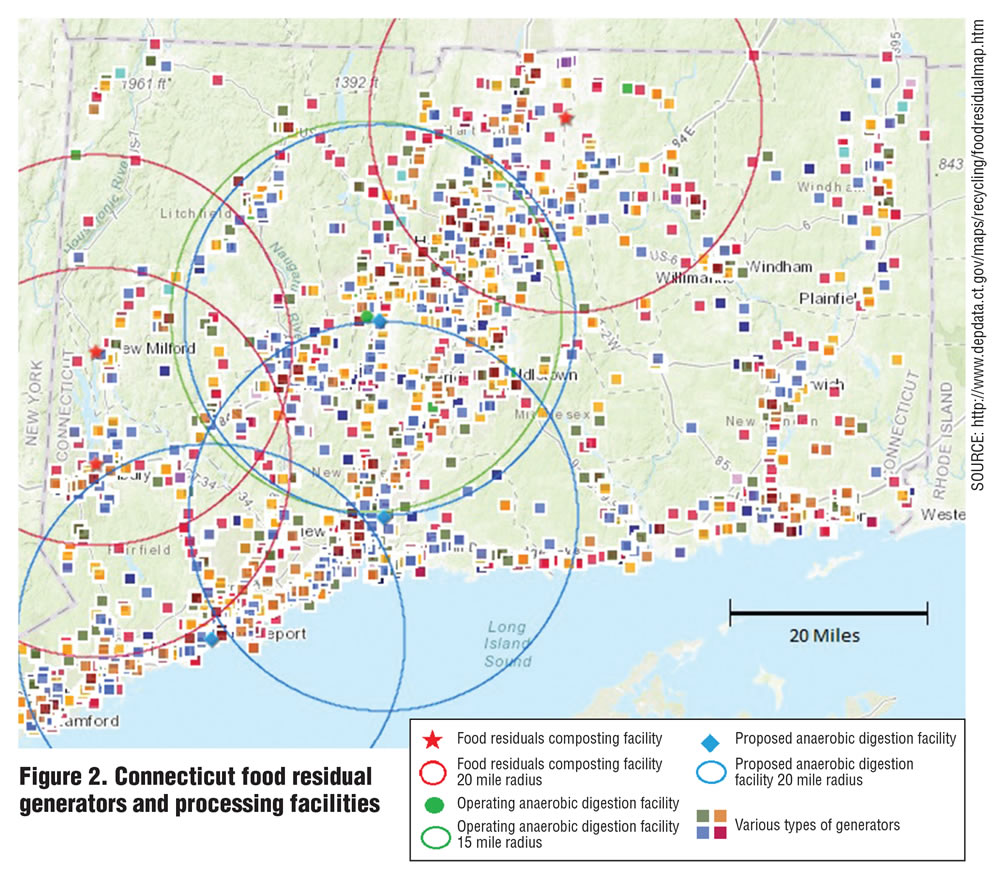
Connecticut is the second largest of the 4 states in population (3.6 million) and quantity of food waste disposed (500,000 tpy) — about half that of Massachusetts. Its stated goal is to divert 60 percent of municipal waste away from incinerators and landfills, and estimates it needs a minimum of 300,000 tpy of organic processing capacity by 2024.
When the disposal ban went into effect in 2014, Connecticut had 3 operating composting facilities located in rural areas near the borders of Massachusetts and New York. Though total permitted capacity was close to 200,000 tpy, those facilities processed just 2,361 tpy of food waste. Their operators report that the ban has not had a big impact on their business. For example, Chris Fields of Harvest New England said that the inconsistency and low quality of food scraps received by his farm-based composting facility would impose greater costs to separate out contamination than benefits accrued.
In contrast, developers of large AD facilities, which have provided the big increase in state capacity since 2014, cite positive impacts of the ban. Quantum Biopower’s merchant plant in Southington is now online (see “Merchant Biogas Plant Services Food Waste Generators,” July 2017), generating biogas, and running trials with food scraps from grocery stores. At full capacity, it will process 40,000 tpy of food waste. Two additional plants are permitted and in development — a merchant plant and a plant colocated at a WRRF but with a separate line for food scraps. Another merchant plant recently received a state notice of “tentative determination to permit.”
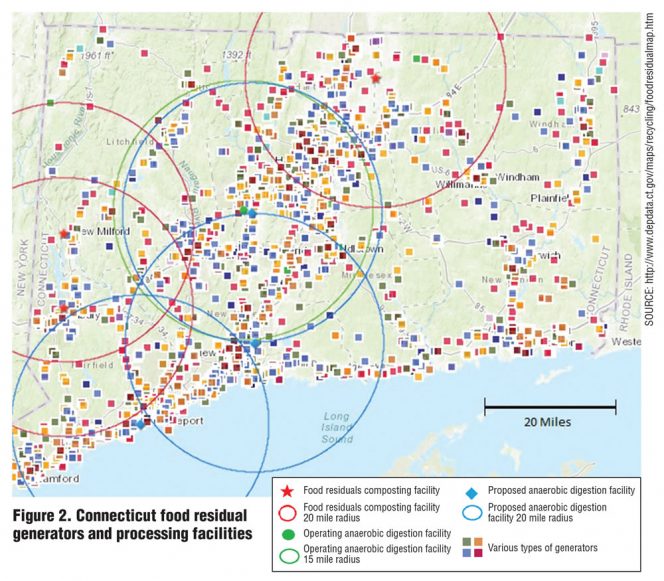
Once all four AD facilities are online, Connecticut will have achieved substantial progress toward its food waste reduction target though there are areas in the east of the state that remain without coverage (Figure 2). To reach its target, Chris Nelson of the Connecticut Department of Energy and Environmental Protection said the state is seeking a diversified portfolio of facility types. Lacking any farm-based AD at this point, Connecticut developed an Agriculture AD Roadmap in 2016 to identify changes in policy to address the gap.
 Rhode Island
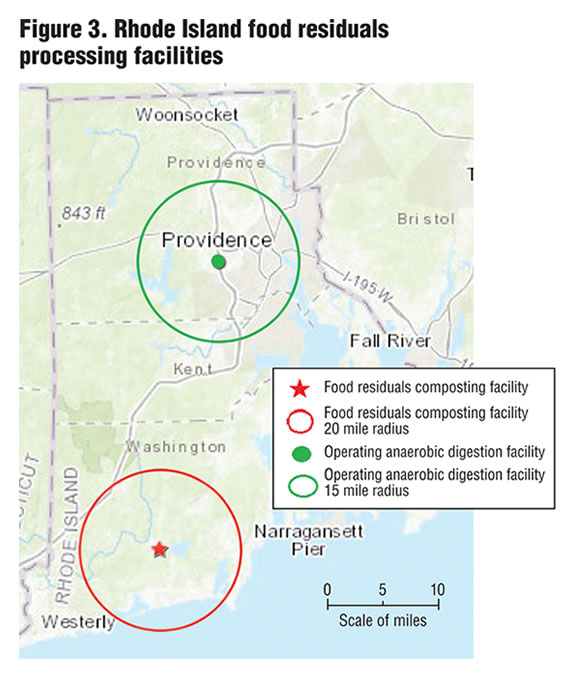
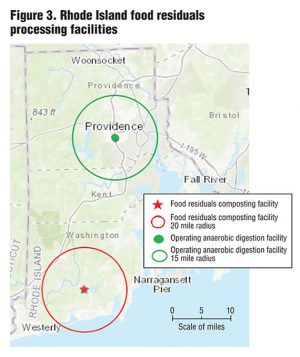
Rhode Island, the state with the smallest land area and highest population density (1.1 million people), generates an estimated 220,000 tpy of food waste. Its stated goal for diversion is 80 percent, or around 174,000 tpy. However, according to the Rhode Island Solid Waste Management Plan 2038 published in 2015, commercial collection and processing of segregated food wastes was “practically nonexistent” prior to the ban.
A big increase in the state’s capacity is coming from a new merchant AD plant developed, owned and operated by Blue Sphere, an independent power producer with 4 plants in Italy and one in North Carolina (Figure 3). Running primarily on food waste and generating 3.2 MW of electric power, the plant has a 15-year power purchase agreement with National Grid, Rhode Island’s primary electricity distributor. Permitted for 73,000 tpy of food waste, the facility’s stated intention is to accept 125 to 150 tons/day (tpd) of food waste feedstock, or 47,000 tpy. During its current ramp-up period, only liquid food wastes are being accepted, but Blue Sphere has long-term supply contracts for food scraps from E.L. Harvey and Organic Waste Management.
The ban also breathed new life into the one small Rhode Island composting facility, Earth Care Farms, which has been accepting food scraps for the last 40 years. Now receiving 4 to 5 tpd of food scraps from generators including colleges and hospitals, Earth Care Farms is expanding operations and collaborating with The Compost Plant, the only licensed organic waste hauler in the state, to distribute its compost product, Rhody Gold. The Compost Plant is proposing to develop a new composting facility in Warren, which would provide geographical coverage on East Narragansett Bay, though it has not yet applied for a permit.
Mark Dennen of the Rhode Island Department of Environmental Management noted he was thrilled with the Blue Sphere plant’s launch, describing the project as “groundbreaking” relative to the status quo of landfilling most food waste. Acknowledging that Rhode Island does not have any other facilities in development, Dennen welcomes all interested parties to bring new projects to the state in order to fully implement the ban and reach the state’s capacity goals.
Vermont
With the largest land area (9 times the size of Rhode Island and 20% larger than Massachusetts) and the smallest population (624, 600, or one-tenth that of Massachusetts), Vermont generates an estimated 60,000 tpy of food waste. Its target is to divert 36,000 tpy — 29,000 tpy to composting and AD — complemented by source reduction and food donation.
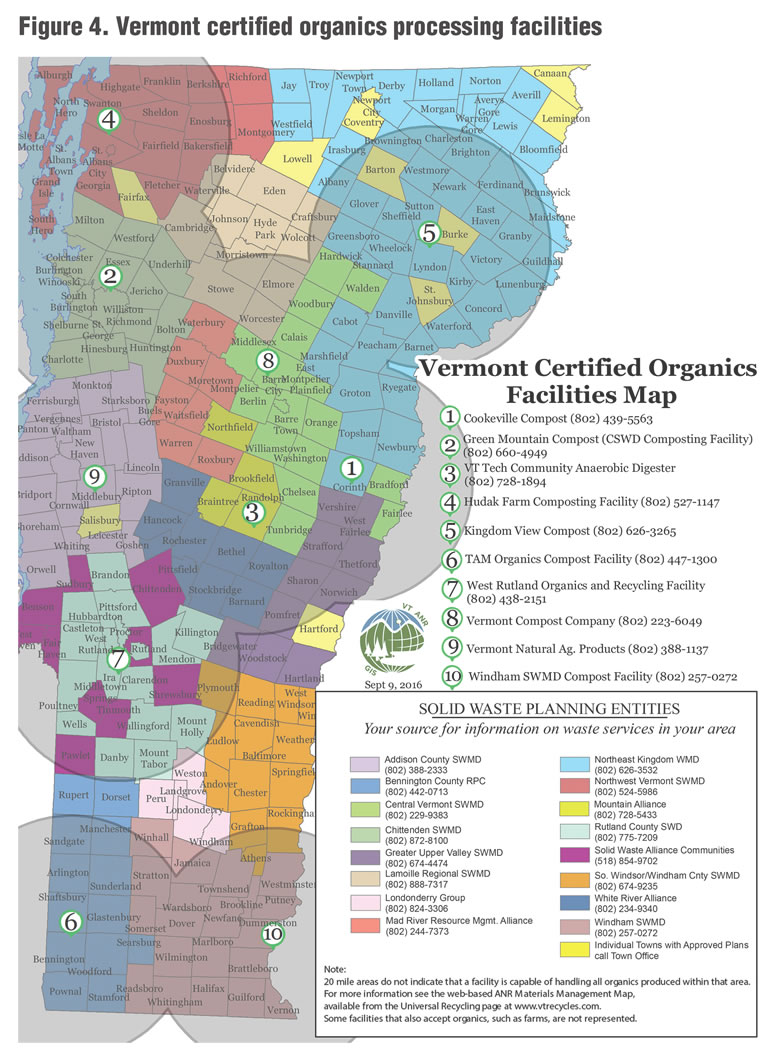
Due to its very low population density and low quantity of total food scraps, as well as its large dairy sector, Vermont has substantially different solid waste economics from the other states. The merchant AD plants the other three states have developed are not economically viable in a rural state due to the much smaller scale of processing potential. Vermont’s focus has been on developing composting facilities complemented by codigestion at dairy-based digesters dispersed across the state.
Like Massachusetts, Vermont had made substantial progress toward its capacity goal by the time its food waste diversion mandate went into effect. In 2014, Vermont’s certified facilities included 10 composting sites and one AD, with a combined capacity of 22,000 tpy. Additional farm-based activities (which do not require permits from the Vermont Department of Environmental Conservation) included 4 farm digesters that accepted only food manufacturing residuals and at least 4 farm-based animal feeding operations.
Vermont has experienced a flux in participation by composting facilities processing food waste. By 2017, two small composters had exited, continuing composters had slightly expanded their food scrap intake, and two new composting facilities have permits and are in development in areas not previously covered by permitted facilities (one in the north and the other in the south-central part of the state, near the border with New Hampshire). For AD, two farms are accepting food scraps under a pilot program, and 4 new farm-based ADs are being considered. Finally, an organics recycling facility that preprocesses food scraps for AD feedstock has been certified, which enables digesters to expand beyond liquid food waste to food scraps. Figure 4 illustrates that most of the land area in Vermont is currently within 20 miles from a processing facility, the distance beyond which compliance is waived until 2020.
Wrap-Up
An organics landfill ban can create greater certainty of a supply of organic feedstock, which provides greater security for developers and haulers to invest. However a ban is not a silver bullet: the economics of the facilities must be sustainable, regulations facilitating permitting must be in place, and planning, outreach and education are needed to provide the impetus.
The following are a few observations:
• The four New England states share critical underlying economic drivers: high disposal tipping fees, high energy prices, and — for all but Vermont — high population densities.
• Also critical to making facility economics work are policies to support markets in renewable energy and soil amendment end products, as well as technical and financial assistance.
• The lesson from Massachusetts’ success in providing capacity to support its landfill ban, according to John Fischer of MassDEP, is the important role of the public sector in providing program resources for planning, education, and technical assistance, as well as strong policy incentives.
• Rhode Island and Connecticut have waivers for generators 15 or 20 miles from a facility, which they may continue to invoke for portions of their states after maximum coverage of generators is reached in 2018 and 2020, respectively. Vermont’s waiver expires in 2020, and the state appears to be on a path to fulfill its relatively small mandate (compared to those of the other 3 states) by the target date of 2022.
• Even with limited program resources, a state can make progress toward its capacity mandates by getting permitting regulations and renewable energy market incentives in place.
• Echoing a refrain from agencies and facilities alike across the states, Josh Kelly of the Vermont Agency of Natural Resources said adopting organics recycling requires social change. The greatest need to promote this change, other than funding to spur investment, is more education.
Carol Adaire Jones, an environmental economist at the Environmental Law Institute (www.eli.org) is Co-Director of ELI’s Food Waste Initiative. She can be reached at jones@eli.org. Timothy Briscoe, an ELI Law Clerk and student at the Washington University in St. Louis School of Law (briscoe@eli.org), was a contributing researcher on the project.
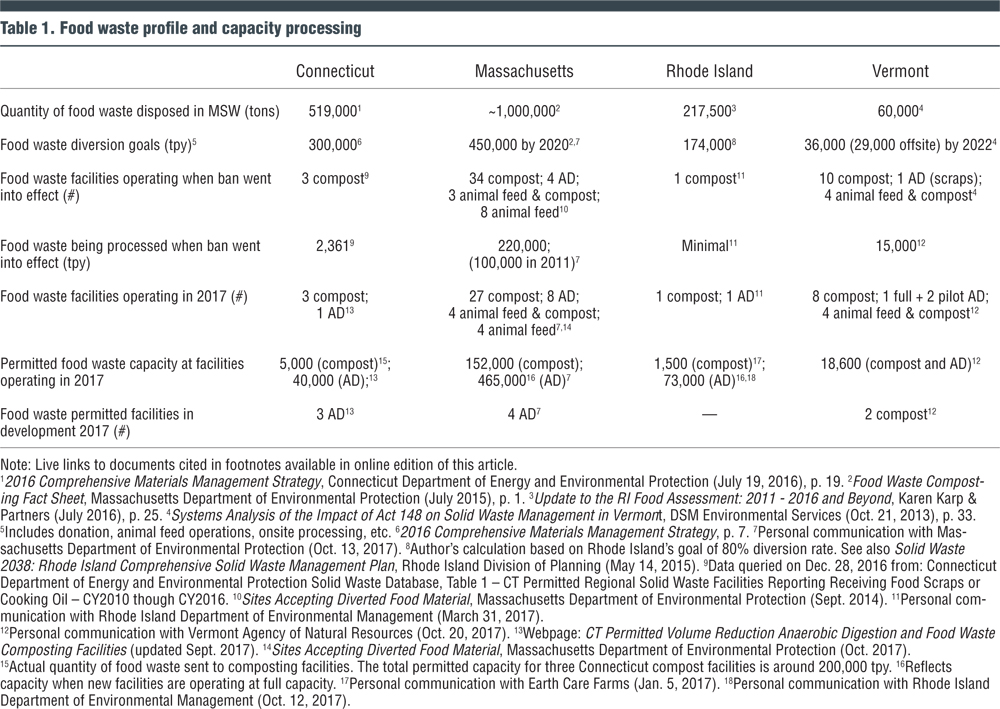
Table 1 footnotes links
1 2016 Comprehensive Materials Management Strategy, Connecticut Department of Energy and Environmental Protection (July 19, 2016), p. 19.
2 Food Waste Composting Fact Sheet, Massachusetts Department of Environmental Protection (July 2015), p. 1.
3 Update to the RI Food Assessment: 2011 – 2016 and Beyond, Karen Karp & Partners (July 2016), p. 25.
4 Systems Analysis of the Impact of Act 148 on Solid Waste Management in Vermont, DSM Environmental Services (Oct. 21, 2013), p. 33, available at .
5 Author’s calculation based on Connecticut’s goal of a 60% diversion rate. See also 2016 Comprehensive Materials Management Strategy, p. 7.
6 Personal communication with John Fischer of the Massachusetts Department of Environmental Protection (Oct. 13, 2017).
7 Author’s calculation based on Rhode Island’s goal of a 80% diversion rate. See also Solid Waste 2038: Rhode Island Comprehensive Solid Waste Management Plan, Rhode Island Division of Planning (May 14, 2015).
8 Data queried on Dec. 28, 2016 from: Connecticut Department of Energy and Environmental Protection Solid Waste Database, Table 1 – CT Permitted Regional Solid Waste Facilities Reporting Receiving Food Scraps or Cooking Oil – CY2010 though CY2016.
9 Sites Accepting Diverted Food Material, Massachusetts Department of Environmental Protection (Sept. 2014).
10 Personal communication with Chris Shafer of the Rhode Island Department of Environmental Management (March 31, 2017).
11 Personal communication with Josh Kelly of the Vermont Agency of Natural Resources (Oct. 20, 2017).
12 Webpage: CT Permitted Volume Reduction Anaerobic Digestion and Food Waste Composting Facilities (updated Sept. 2017),
13 Sites Accepting Diverted Food Material, Massachusetts Department of Environmental Protection (Oct. 2017).
14 This represents the actual food waste sent to composting facilities. The total permitted capacity for the three Connecticut compost facilities is around 200,000 tpy.
15 Reflects capacity when new facilities are operating at full capacity.
16 Personal communication with Jayne Senecal of Earth Care Farms (Jan. 5, 2017).
17 Personal communication with Mark Dennen of the Rhode Island Department of Environmental Management (Oct. 12, 2017).
Correction, November 14, 2017:
Figure 2 legend originally mislabeled blue star and circle