U.S. EPA survey of operators of anaerobic digestion facilities that accept food waste provides a national picture of total processing capacity, tons processed, and biogas produced.
Nora Goldstein
BioCycle July 2018
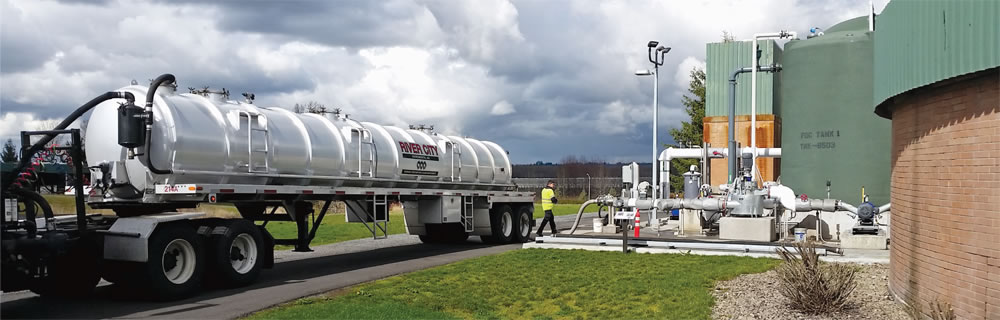
Photo courtesy of City of Gresham, OR
In 2017, EPA surveyed U.S. operators of anaerobic digestion (AD) facilities that accept food waste to identify the number of facilities in the U.S. and their locations, and to learn about their operations. A report on the findings, Anaerobic Digestion Facilities Processing Food Waste in the United States in 2015, was released by the U.S. EPA Region 3 office in late May (2018) (the final version was released in August 2018 and is available at link above). Melissa Pennington of U.S. EPA Region 3 conducted the survey and analyses of the results, and authored the report. This is the first of three annual data collections EPA will make through 2019, and covers data for calendar year 2015. Future reports will summarize data for 2016, 2017, and 2018. This article is based on excerpts from the full report.
 EPA determined the number of AD facilities known to accept food-based materials by reviewing publicly available information. In most cases, the operational status of the facilities was confirmed through direct contact with operators, a portion of which provided survey responses. Surveys were developed for three categories of facilities codigesting food waste — stand alone, on-farm, and water resource recovery facilities. The surveys were emailed directly to digester operators. The survey forms also were available on EPA’s Anaerobic Digestion website. EPA collected data from January 2017 through December 2017.
Completion of the survey was voluntary and the data collected was voluntarily reported by survey respondents. Information submitted via the surveys that was not publicly available (e.g., contact information, addresses, phone numbers) was not included in this report. The technical data collected for each facility (e.g., processing capacity) were aggregated and summarized such that individual facility information could not be identified.
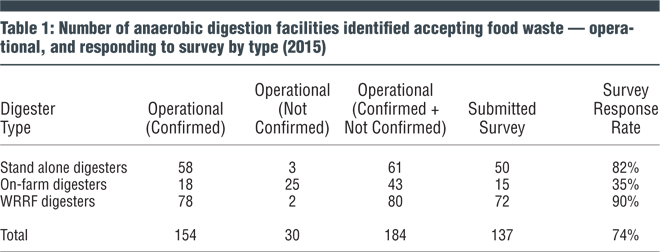
 EPA confirmed that 154 AD facilities processing food waste were operational. As described below, another 30 facilities are believed to be operational, bringing the total operational (confirmed plus unconfirmed) to 184. Surveys were returned by 137 of the 184 total operational facilities (Table 1). EPA’s research also identified facilities that have ceased operations, are in the planning, design and construction phase, or did not advance beyond the pilot stage for a variety of reasons.
Digester Categories
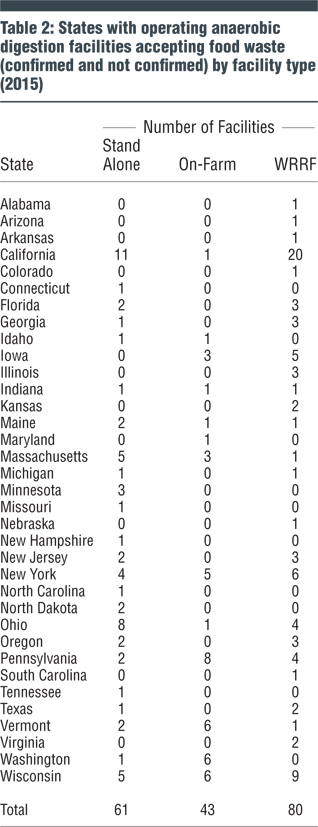
Table 2 summarizes the data received for operating AD facilities accepting food waste (confirmed and unconfirmed) by facility type and by state where facility is located. The following provides additional details on the three types surveyed.
Stand Alone Digesters
Stand alone digesters are primarily built to process food waste. While many accept other organic materials (e.g., manure, wastewater solids), they are typically designed to process food waste. The survey divided stand-alone digesters into two categories:
Multi-Source Food Digester is a type of stand alone digester that accepts and processes feedstocks from off-site sources. These feedstocks are accepted both for their tipping fee revenue and their biogas yield potential. These digesters are sometimes called “merchant digesters.” Feedstocks are predominantly food waste, although non-food waste feedstocks (e.g., manure and wastewater solids) may also be processed at stand-alone digesters. In most instances, feedstocks are obtained from many different sources.
Industry Dedicated Digester is a type of stand alone digester typically developed to manage food waste generated from a single business (e.g., grocery store chain, food or beverage processing plant). These digesters do not typically accept organic materials from other sources for tipping fees.
EPA received 50 survey responses from a field of 61 operational stand-alone facilities (82% response rate). The Agency confirmed that 8 of the 11 facilities that did not submit data are operational (the other 3 are believed to be operational). Of the 50 responses, 28 are multisource (56%); 20 are industry dedicated (40%); and two were identified by survey respondents as “other” (4%). Operational stand alone digesters are located in 24 states.
On-Farm Digesters
According to EPA’s AgSTAR program, approximately 250 anaerobic digester facilities are operating on livestock farms in the U.S., primarily for manure management. This survey targeted only those digesters that codigest food waste. EPA received 15 survey responses out of the 43 operational on-farm digester facilities that are codigesting food waste, for a 35 percent response rate. The remaining 28 farms did not submit data. EPA confirmed that three of the 28 that did not submit data are operational. Information on the other 25 farm digesters was found in articles in BioCycle and other publications, American Biogas Council (ABC) profiles, etc.
Digesters at WRRFs
The Water Environment Federation (WEF) and ABC maintain a database (biogasdata.org) of information on WRRFs. It identifies approximately 1,200 WRRFs in the U.S. that have anaerobic digesters to manage wastewater solids; roughly 20 percent codigest materials from off-site sources, including food waste. EPA received 72 survey responses from a field of 80 WRRFs with operational food waste codigestion systems for a response rate of 90 percent. The remaining 8 did not submit data. EPA confirmed that 6 of these 8 facilities are operational. The other two are believed to be operational.
Food Waste Processing Capacity, Tons Processed
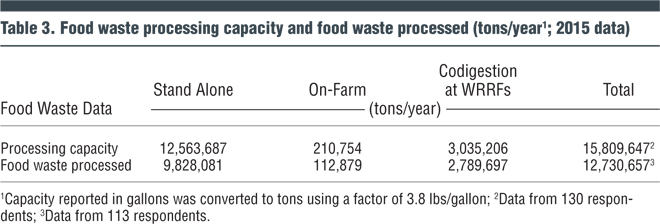
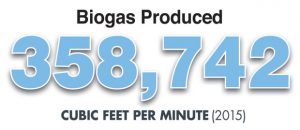 Table 3 summarizes the food waste processing capacity, and actual tons of food waste processed, by digester type.
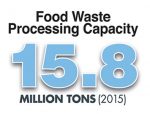
Processing capacity refers to the maximum amount of food waste feedstock an anaerobic digester can accept per unit time. In this survey, that unit time was one year. EPA collected data on food waste processing capacity in either gallons or tons. Capacity reported in gallons was converted to tons using a factor of 3.8 lbs/gallon (USEPA-ORCR, 2016). Based on a survey response rate of 95 percent for information about food waste processing capacity, total capacity for processing food waste in all three digester types combined is 15,809,647 tons/year. The actual processing capacity is likely to be higher than the values reported because not all facilities known to be operating responded to the survey.
EPA asked operators of on-farm digesters to account for the average volume of manure digested to help estimate their capacity for food waste. Plant operators at WRRFs were asked to consider their facility’s available capacity to accept feedstocks from off-site sources for all digesters combined, taking into account the average volume of wastewater solids and the total capacity of the digesters.
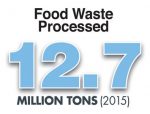
The total amount of food waste processed in all three digester types was 12,730,657 tons. Similar to processing capacity, the actual amount processed is likely to be higher than the values reported because not all facilities known to be operating responded to the survey.
Feedstock Types, Sources And Preprocessing
 Feedstock Types
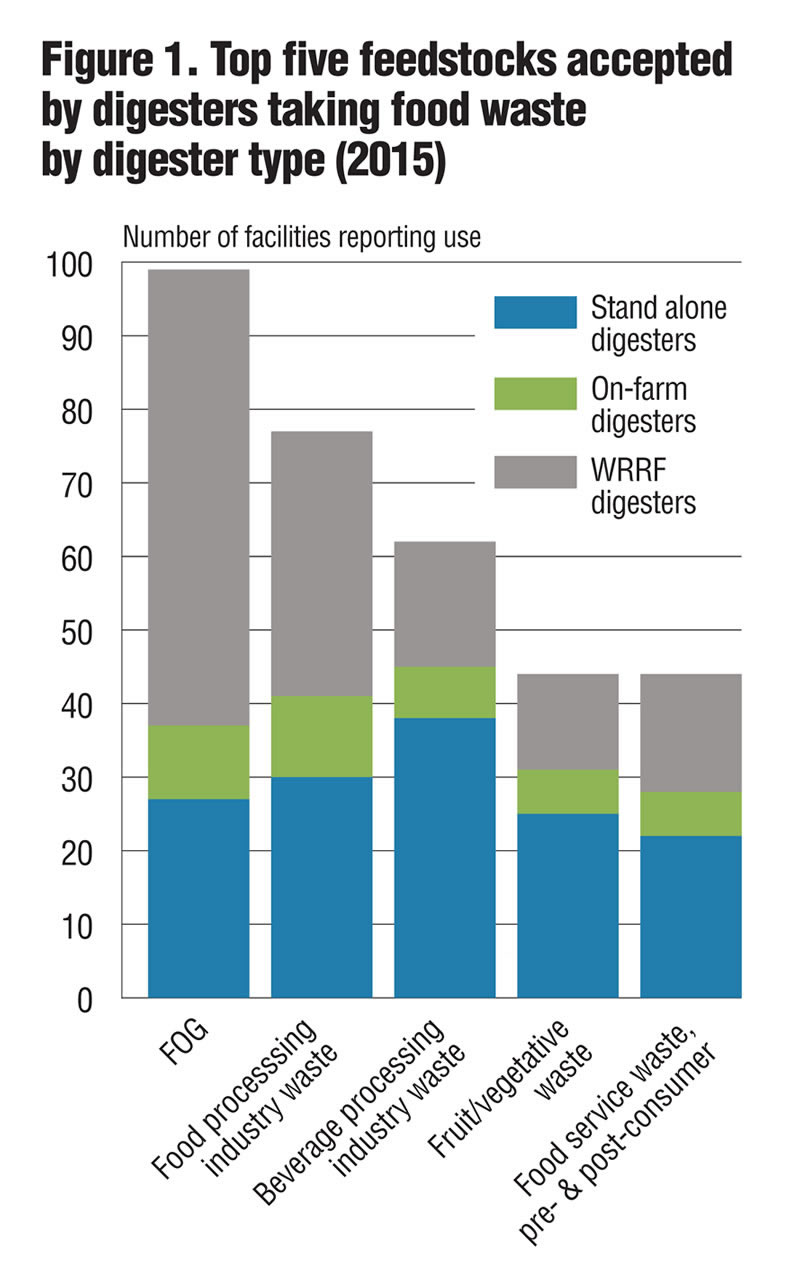
A wide variety of feedstocks are processed in these digesters throughout the U.S. They vary based on local availability, demand, and type of digester accepting the feedstock. Respondents from 48 of the 50 stand-alone facilities, all 15 on-farm digesters, and all 72 WRRFs provided data on the types of feedstocks processed in 2015. Figure 1 summarizes the top five feedstocks accepted by digester type. EPA did not collect data on the amount of individual feedstocks processed.
EPA classified feedstocks as follows:
• Food: Beverage processing industry waste; food processing industry waste; fats, oils, and greases (FOG); fruit/vegetative wastes; food service waste (pre and postconsumer); retail food waste; rendering wastes; and source separated commercial, institutional or residential organic wastes.
• Non-Food: Crude glycerin; manure; wastewater solids (sludge); septage; crop residues; mixed yard waste; deicing fluid; lab (or pharma) wastes; paper mill wastes.
Feedstock Sources
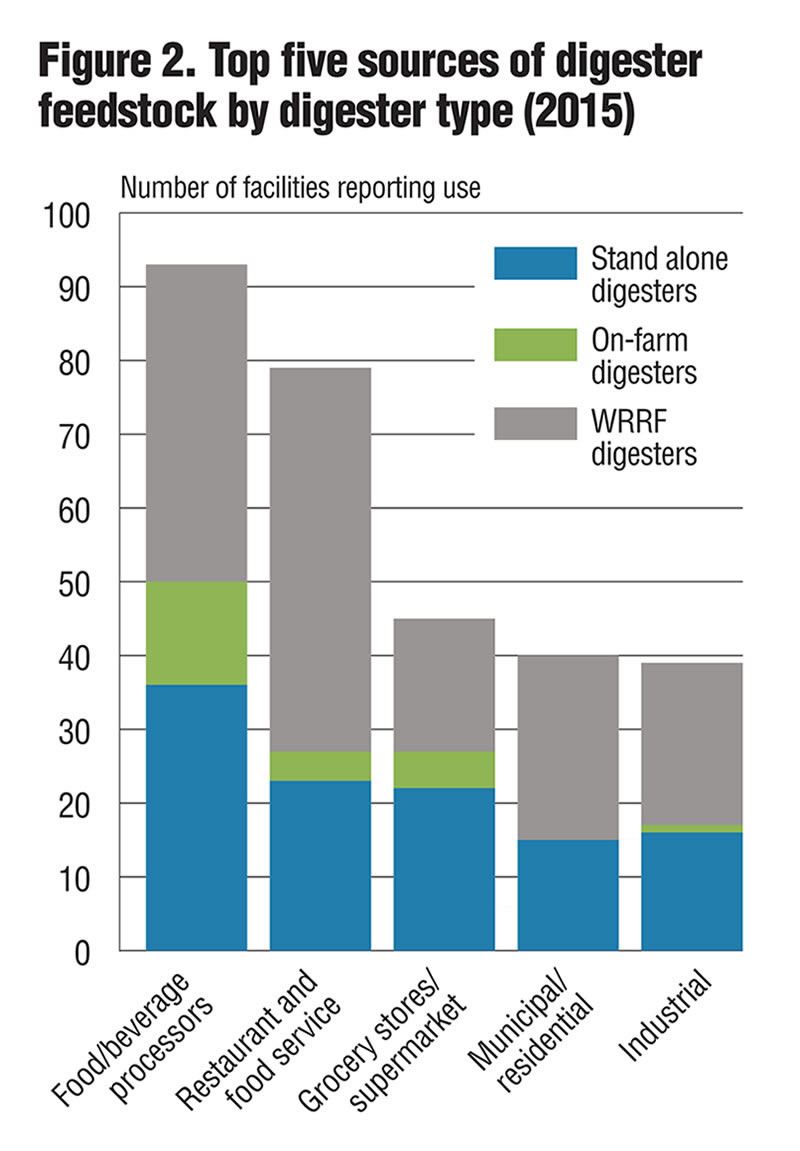
The survey question about feedstock sources directed respondents to identify all sources for the feedstocks that were received and processed at each facility. Some digesters have multiple sources and some have one or just a few. Figure 2 shows the top five sources of feedstock by digester type. Respondents from 48 of the 50 stand-alone facilities (96%), all 15 on-farm digesters (100%), and 71 of 72 WRRFs (99%) provided data on sources of feedstocks processed in 2015.
 Preprocessing/Depackaging
EPA asked operators about the types of preprocessing and depackaging performed at their facilities. The following are a few highlights based on the responses:
•At stand-alone facilities (15 reporting), 10 use manual or mechanized depackaging and 6 report using grinding and/or maceration. Two reported using third party processing.
•Three on-farm digesters utilize manual or mechanical depackaging, and 2 use third party processing (6 reporting)
•At WRRFs (30 reporting), 14 screen for debris, 11 utilize third party processing, 8 do grinding and/or maceration, and 5 heat the food waste prior to digestion.
Biogas Production And Use
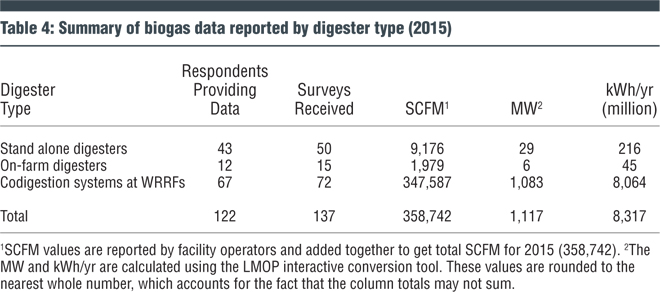
Biogas production data was collected in, or converted to, standard cubic feet per minute (SCFM), the industry standard unit of measurement for biogas. Total biogas produced is 34,967 SCFM. (That total was revised by EPA on 9/27/18, which also affected totals in Table 4 in the print version of this article in BioCycle. View revised EPA report for updated totals.) SCFM was then used to estimate installed capacity in megawatts (MW), and generation potential in kilowatt-hours per year (kWh/yr) using methods found in the EPA’s Landfill Methane Outreach Program interactive conversion tool website (USEPA, 2016).
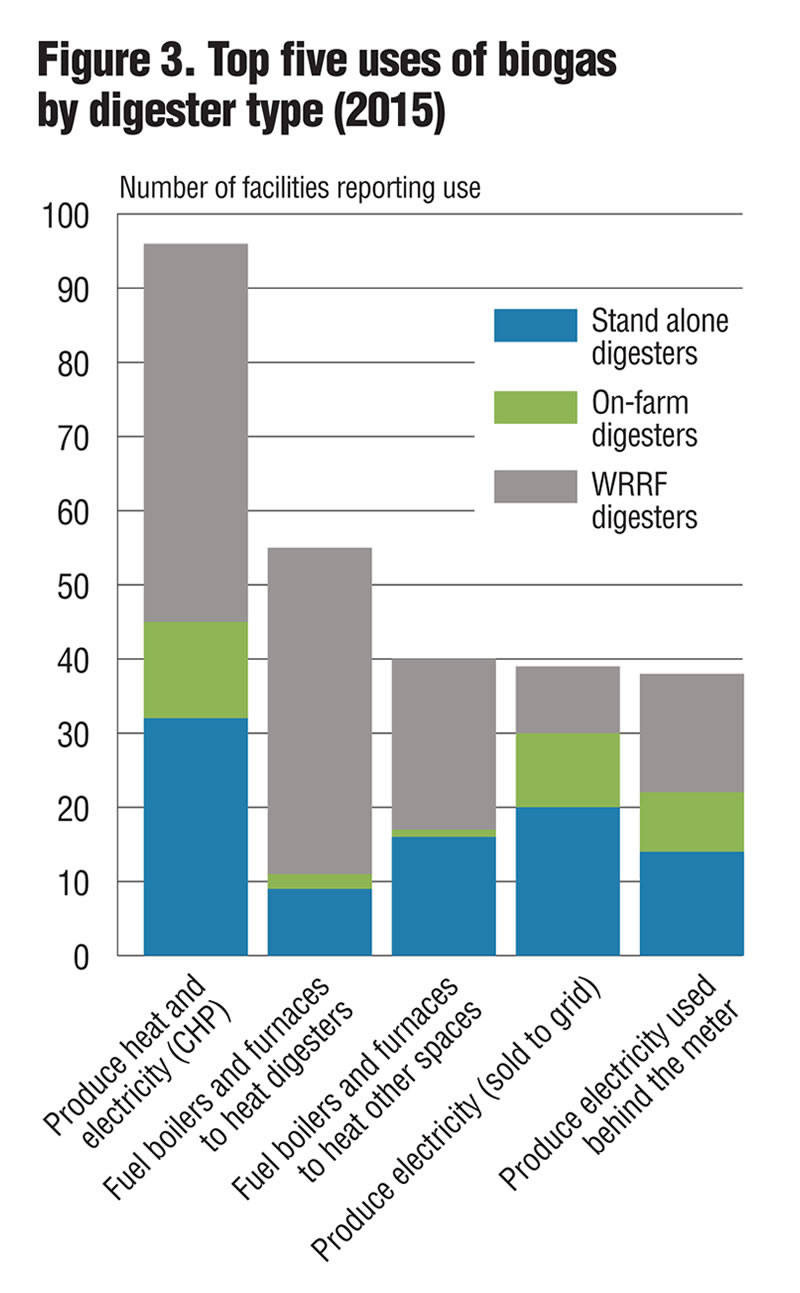 Most facilities have more than one use for the biogas, and the survey permitted multiple responses. Respondents from 49 of 50 stand-alone facilities (98%), all 15 on-farm digesters, and all 72 WRRFs provided data on biogas uses. Figure 3 highlights the top 5 uses of biogas produced at AD facilities as reported by each type of respondent.
At stand alone digesters, 82 percent reported that all the biogas produced was used; in 2015, 62 percent used the biogas onsite, 10 percent sold it and 26 percent used it both onsite and sold it. At the on-farm digesters reporting, 80 percent used the biogas onsite, 27 percent sold it, and 60 percent flared at least some of the biogas. For WRRF codigesters, 94 percent used the biogas onsite, 8 percent sold it and 63 percent flared at least some of the biogas. Two WRRFs out of 72 flared all of the biogas they produced.
Four of the stand alone food waste digesters reported compressing the biogas for use as vehicle fuel for their own fleet or personal vehicles; three reported selling the vehicle fuel to customers (as did one WRRF). Two stand alone digesters and 2 WRRFs reported processing the biogas into Renewable Natural Gas for pipeline injection.
With regard to gas cleaning systems, the data reported show that in 2015 they were utilized at 78 percent of stand-alone food waste digesters, 73 percent of on-farm digesters that codigest food waste, and 65 percent of digesters at WRRFs that codigest food waste.
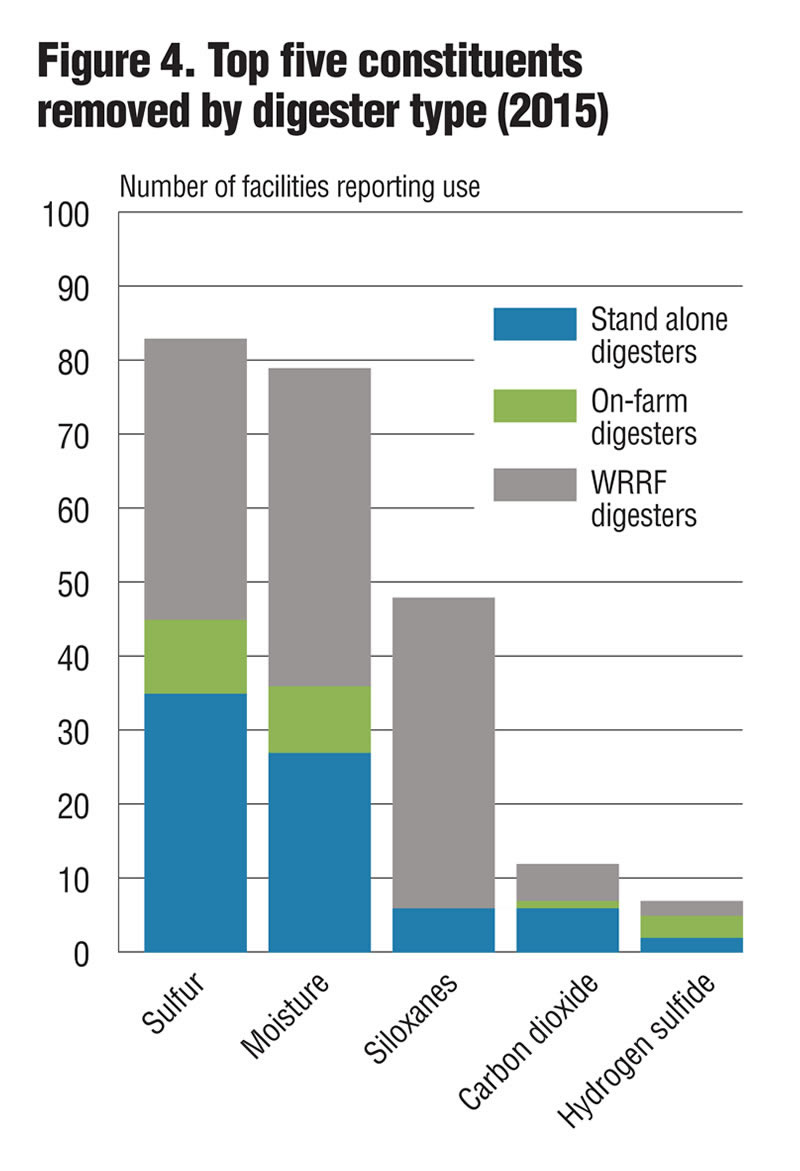 Figure 4 shows the top five constituents removed by digester type.
Solid And Liquid Digestate Uses
The top three solid digestate uses by specific digester type were:
• Stand Alone Digesters: Composted into a reusable/salable product, dewatered/dried and land applied; and “other”
• On-Farm Digesters: Processed into animal bedding, dewatered/dried and land applied, and composted into a reusable/salable product
• WRRFs: Dewatered/dried and land applied, landfilled, and composted into a reusable/salable product
The top uses of liquid digestate for stand alone digesters, on-farm digesters, and codigestion facilities at WRRFs, respectively, were: discharged to a wastewater treatment plant, reused as fertilizer via land application, and recirculated through the digester.
Of the 20 stand alone digesters that reused digestate as fertilizer via land application in 2015, only two further processed it prior to application. Only one on-farm digester operator indicated that the liquid digestate was further processed prior to application. None of the 6 WRRF codigesters land applying the liquid digestate reported further processing it prior to application.
References
USEPA ORCR, April 2016. Factor comes from U.S. EPA Volume-to-Weight Conversion Factors (pdf file).
USEPA, LMOP, May 2016. LMOP Interactive Conversion Tool (xls file).