 BioCycle October 2008, Vol. 49, No. 10, p. 23
Environmental benefits calculator proves that composting is the best management option from both economic and environmental perspectives.
Clarissa Morawski
FOR many years, life cycle analyses of end-of-life management practices have been available for all of the basic recyclables as well as organics. The life cycle data, usually derived by the U.S. Environmental Protection Agency’s WAste Reduction Model (WARM), represents the net greenhouse gas impact of recycling, landfilling or incinerating a variety of material streams. The model calculates emissions in metric tons of carbon equivalent, metric tons of carbon dioxide equivalent and energy units.
Product life cycle data from Carnegie Mellon University’s Economic Input-Output Life Cycle Assessment (LCA) model, measures seven environmental impacts: climate change expressed as CO2 equivalents; human health expressed as particulates, toluene equivalents (toxics), and benzene equivalents (carcinogens); eutrophication expressed as nitrogen equivalents; acidification expressed as sulfur dioxide equivalents; and ecosystem toxicity expressed as herbicide 2,4-D equivalents (based on USEPA’s TRACI – Tool for the Reduction and Assessment of Chemical and other environmental Impacts – model). Together, WARM and the Carnegie Mellon LCA tool (RTI, 2006; EIOICA, 1995) offer the ability to understand the full environmental impact of our decisions on how to manage various components of the waste stream.
While the life cycle data on recycling is informative, it is difficult for decision-makers, as well as lay people, to understand what the pollution profile actually means in terms of the real impact on human health and the environment. Which pollutant is worse: a ton of nitrogen equivalents or particulate matter? Is carbon dioxide the most important emission to reduce? How bad are toxics? What does it all mean?
THE MORRIS FACTOR
Dr. Jeffrey Morris of Sound Resource Management, based in Washington State, has developed an Excel-based model called “Environmental Value of Recycling and Composting.” We’ll call it the “Morris Environmental Benefits Calculator (MEBCalc).” It is the culmination of research projects and peer-reviewed articles going back more than five years, including work for the San Luis Obispo County (California) Integrated Waste Management Authority, Seattle Public Utilities, the Washington State Department of Ecology and the King County (Washington) Department of Natural Resources.
The MEBCalc applies the inputs (in tons) to the LCA data from the USEPA and Carnegie Mellon University. The resulting pollution estimates are then standardized into one measurement: Currency, or more specifically, U.S. dollars. This holistic approach to fully understanding the implications of waste management on both human health and the environment, and the cost of those implications, will fundamentally shift the way that waste management methods are viewed in the future.
COSTING OUT POLLUTION
Morris applies a monetary value to each pollutant, based on either the estimated real financial costs to society in terms of environmental degradation and human health impact, or the actual market value of the pollutant’s emissions established through trading schemes such as auctions for USEPA’s sulfur dioxide emissions permits under the Clean Air Act’s provisions for controlling acid rain. According to Morris, monetization provides a method for evaluating trade-offs between the seven types of environmental impacts, and is a standard approach within the field of environmental economics. He acknowledges that monetization can be controversial, but demonstrates that it is a very helpful method when comparing the environmental benefits to the financial costs for recycling and composting.
One example of monetization is assigning a value to a ton of CO2. Carbon dioxide emission reduction credits are traded throughout the world today at varying prices. In countries with regulated schemes, the prices sometimes run well over $100/ton, while in the unregulated market of North America, the price of CO2 is anywhere from $1 to $4/ton. (In late September, an auction of carbon credits in Connecticut, Maine, Maryland, Massachusetts, Rhode Island and Vermont sold 12.6 million allowances at a price of $3.07/ton each.) The recently completed Stern review (Stern, 2007) on the economics of climate change estimated the environmental cost of a metric ton of CO2 emissions at $85. In his calculator, Morris assigns a value of $36/ton, a conservative estimate based on the range of benefits and market valuations for CO2 emissions reductions. This is also the GHG offset valuation used by Seattle City Light, a municipal electric utility.
As another concrete example, reducing sulfur dioxide equivalent emissions by one ton is valued at $661 based on a rolling average of spot prices for SO2 emissions permits in USEPA’s annual acid rain allowance auction. Morris assigns a value to each group of pollutants and references their source. Monetizing reductions in emissions of pollutants that cause the other five types of environmental harm, besides climate change and acidification are based on scientific studies on the health and ecological costs of these environmental impacts. For example, the human health costs of toxics is based on a Harvard University Center for Risk Analysis study on the health costs of mercury emissions, while the cost to ecosystems of ecologically toxic emissions is based on an Ohio State University Integrated Pest Management Program study about putting an environmental price on pesticide use.
Table 1 shows the calculator’s values for public health and ecological benefits from reducing emissions for each impact category. They range from $4/ton for eutrophication to $10,000/ton for particulates.
APPLYING BENEFITS OF COMPOST USE
To date, most life cycle studies on organics diversion fall short because they do not account for the environmental benefit associated with the application of finished compost. For example, using compost in landscaped parts of roads, bicycle paths and parks reduces irrigation requirements; retains water and reduces leaching loss for plants; reduces soil erosion and runoff; suppresses weeds; and reduces herbicide requirements (NSW, 2005).
Further, using compost as top dressing on playing field surfaces requires less water; maintains good turf growth under stressful conditions; improves soil structure, water infiltration and water holding capacity of the soil; slowly releases essential macro and micronutrients to turf growth, reducing the need for mineral fertilizers and making these fertilizers more effective; supplies nitrogen and iron for long-term greening; and can suppress grass diseases and reduce the need for regular pesticides application (NSW, 2005).
While these qualitative benefits are difficult to quantify, the MEBCalc attempts to monetize the value of using the finished compost. According to Morris, compost produced from yard debris, food scraps and compostable paper and cardboard can substantially reduce the use of pesticides and synthetic fertilizers on lawns and gardens. Based on peer-reviewed research published in The International Journal of Life Cycle Assessment (Morris and Bagby, 2008), Morris conservatively estimates that compost use on lawns and gardens is associated with a 50 percent reduction in pesticide and synthetic fertilizer use.
Morris relies on existing life cycle data from the Carnegie-Mellon Economic Input-Output Life Cycle Assessment (EIOLCA) tool, supplemented in this instance with data from the peer-reviewed research in InJLCA, to inventory the pollution generated from synthetic nutrients and a pesticide approach to lawn and garden care (Table 2). What is not accounted for, however, is the exposure of chemicals to persons or wildlife at time of pesticide application, as well as the impacts from disposal of pesticides in the garbage.
The final calculation to assess the economic value of the environmental cost or benefit of composting organics is obtained by subtracting the avoided environmental cost/benefit of diversion from the default disposal method – landfill or energy-from-waste (EFW) – and adding on the benefits shown in Table 2, derived from using finished compost as a replacement for 50 percent of pesticides and synthetic fertilizers.
APPLYING THE MEBCalc
Last fall the Region of Niagara (population about 450,000) in Ontario, Canada commissioned a study to undertake a full cost accounting review of region-wide composting of food waste, and leaf and yard waste, versus other waste management options like landfill and EFW. The consultant (CM Consulting) used the MEBCalc as the primary tool to assess the impacts of various end-of-life management options.
In the case of Niagara Region, the study looked at about 52,000 tons of organics, of which about 16,400 tons are food waste and 35,600 tons are leaf, yard and bulky organics. The model was run against aerobic composting; landfill with gas flaring; landfill with electricity generation (assuming 75 percent methane capture); and mass burn EFW using data from an assessment done for a proposed facility in southern Ontario.
Table 3 provides a summary of the net environmental benefits of each process per ton. Unlike calculating the net benefit of EFW and landfilling, the composting net benefit requires subtracting the landfill benefit (as composting is replacing the landfill option in Niagara) and further adding the benefit of compost use.
Once the monetary values are applied to each pollutant (as per Table 2), a monetized environmental benefit of each process is obtained (Table 4).
THE FINAL STEP
In an effort to incorporate the actual operational costs of each option, the final step of this full-cost accounting exercise is to subtract the environmental benefit from the per ton cost of composting, landfill or EFW. This is expressed as:
$ True Cost = $ Net Cost of operations – $ Monetized environmental cost benefit
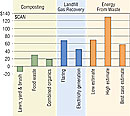
In the case of Niagara region, there were three estimates for EFW based on a variety of different assumptions, for a low, high and best-case scenario cost per ton. Table 5 provides a summary of the results of the analysis.
The resulting “true cost” – represented by the operational cost minus the environmental benefit – applied to the case of the Niagara Region shows that composting leaf, yard and brush waste actually has a “negative” cost per ton ($30.69 – environmental benefit of $44.22 = -$13.53); food waste composting is $29.96/ton; and combined organics costs $18.60/ton. These costs are lower than the alternatives of landfill with gas recovery at $45.09/ton and best case scenario for EFW at $57.29/ton.
These findings set an important new precedent for waste management accounting. So large is the cost differential between composting and other disposal options that the debate around the economic merit of composting is over. Truly, composting is the best bang for the buck.
Clarissa Morawski is Principal of CM Consulting in Peterborough, Ontario. She can be contacted at morawski@ca.inter.net.
REFERENCE CITATIONS
Carnegie Mellon University Green Design Institute’s Economic Input-Output Life Cycle Assessment model available on the Internet at www.eiolca.net.
Cost/Benefit of Using Recycled Organics in Council Parks and Gardens operations in NSW, December 2005, Department of Environment and Conservation, NSW.
Morris, Jeffrey, and Jennifer Bagby (2008). Measuring Environmental Value for Natural Lawn and Garden Care Practices. International Journal of Life Cycle Assessment, 13(3) 226-234.
Research Triangle Institute (2006). MSW Life-Cycle Database, prepared for Atmospheric Protection Branch, Natl. Risk Management Research Lab., US EPA.
Stern, Nicholas (2007). The Economics of Climate Change: The Stern Review, Cambridge University Press, Cambridge, England and New York, New York.
US EPA, Solid Waste Management and Greenhouse Gases: A Life-Cycle Assessment of Emissions and Sinks, 3rd Edition, September 2006.