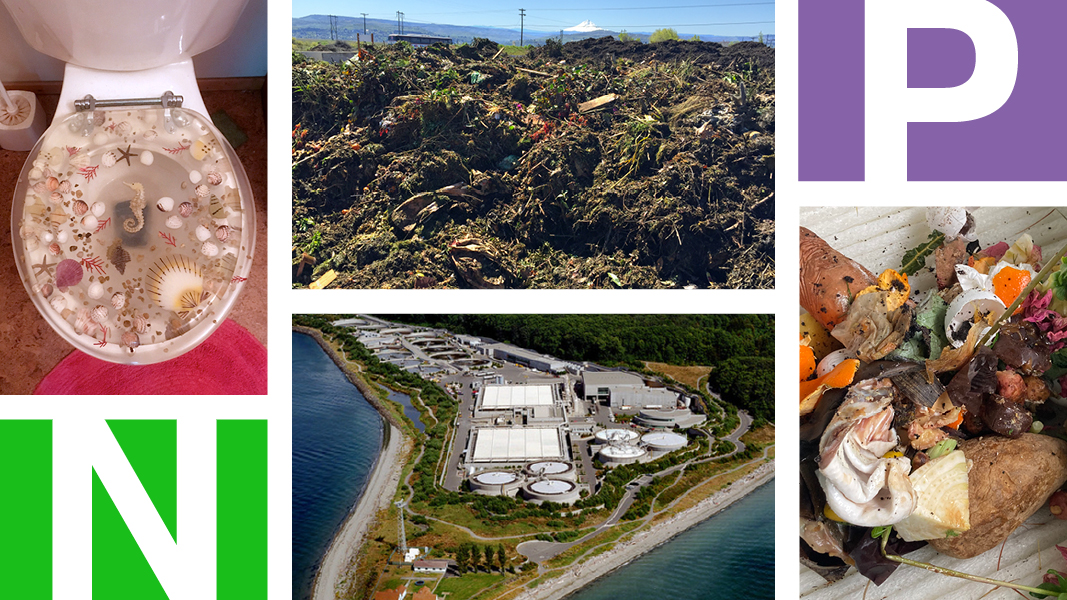
Top: Photos courtesy King County, Sally Brown
 Sally Brown
You want to see the center of the environmentally correct universe? Seattle awaits. Those of you just now thinking about separating out your food scraps, we’ve been doing that since 2009. Our biosolids have been beneficially used since before most of you started flushing. Tacoma, Washington, the small city to the south, has a biosolids program that others around the globe have copied. Their program is a ‘pick your product’ with options including Tagro classic (best for topdressing a lawn) and Tagro potting soil. While not yet officially requiring food scraps diversion, Tacoma has had an active yard waste composting program for decades and does not discourage mixing some yellow broccoli with yellow leaves.
Seattle has been collecting food scraps for composting since 2009. Photo by Sally Brown
On paper, both cities are well ahead of most of the country. I say this with regards to the programs offered to residents and with the municipal mindsets. Here we took a deeper dive to see how well the cities actually do with nutrient recovery. Let’s start with food scraps. For Seattle, we turned to Seattle Public Utilities (SPU) and data on food scraps from 2010 through 2021 (Seattle Public Utilities). The tons in this report are based on measured tons at transfer stations. The fraction of the tons from single and multifamily homes were extrapolated based on another SPU study that actually measured waste composition. For Tacoma, information was taken from a waste characterization study done in 2015 and a conversation with Dan Corum, Research Conservation Specialist for the city.
First the good news. The amount of food waste generated in both cities is well below estimates for per capita food waste generation nationally. According to EPA, in 2010 each person wasted about 109 kgs of food/year. The food loss and waste reduction goal for 2030 is to cut that amount in half. Like I said, we are way ahead of the curve in Seattle. Back in 2009, people living in single family homes did generate about 123 kg/year of food scraps. By 2021 that was down to 65 kg. For the half of us (myself included) who live in multifamily units, we started out low and got lower— 56 kg in 2010 and 29.5 kg by 2021. Tacoma is also ahead of the curve with a food scraps generation rate of about 61 kg per person annually.
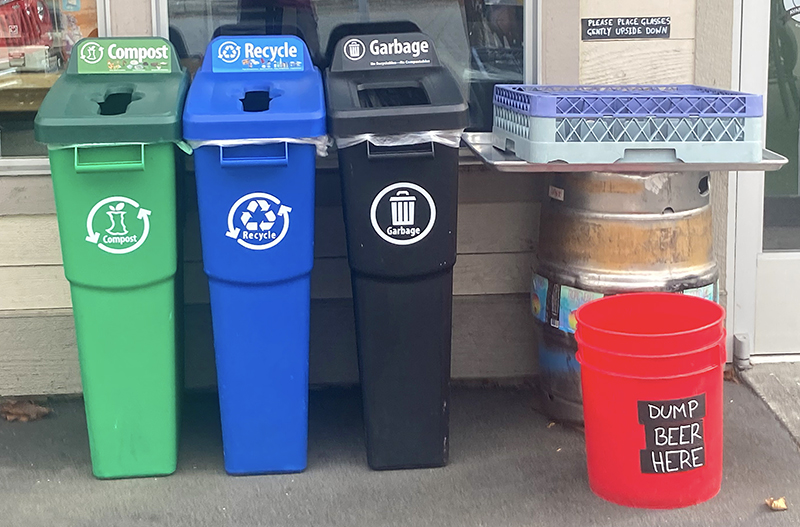
Now the not nearly as good as you hoped news. While participation rates are high in the food scraps composting program in Seattle, the actual amount of the food that households put into the green bin is not exactly stellar. For people living in single family homes in Seattle, about 50% of the food scraps actually go to composting. While that is up from the 30% to 40% recovery rate at the start of the program, you would require a significant curve to rate that an ‘A’. For multifamily homes, the capture rate is below 10%. In Tacoma, the quantity of food scraps that are captured is ‘negligible’.
N And P In Food Scraps
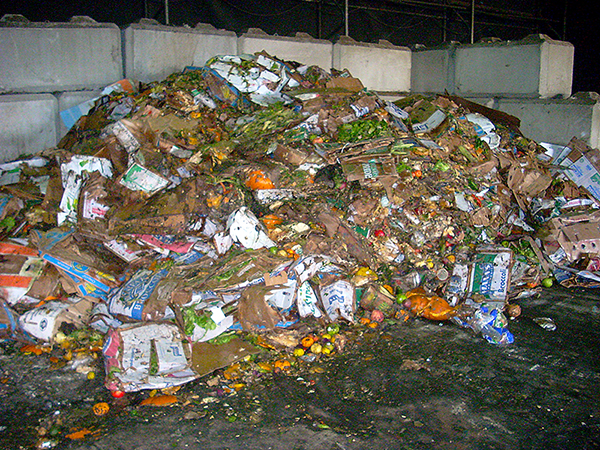
Food scraps collected from households and businesses in Seattle. Photo courtesy Seattle Public Utilities
To translate those quantities into how much nitrogen and phosphorus was contained in the food scraps, we used an analysis from a study out of San Francisco (Zhang et al., 2007), which measured percent solids and total N and P in municipal food waste. If all the food scraps in single family homes in Seattle were composted and all of the N and P in those conserved, that would net about 0.6 kg and 0.1 kg of N and P, respectively, per person. A far cry from the 6.6 kg N and 1.1 kg P that is needed to grow non animal related crops.
The totals are even lower for multifamily residents: 0.28 and 0.05 kg N and P. In both cases, not all of that is collected. It comes down to less than 0.25 kg N and 0.01 kg P per person per year. Put all of the outreach, extension and Seattle pride to work and up those percentages, and it is still not enough to grow all of our food. Some of our food for sure, and much better than nothing. Plus you get that methane avoidance and soil carbon storage. It is a lot better than nothing but far from a silver bullet. The big lesson here for me is that reducing the amount of food we waste should be the first order of business. Repurposing the food that we don’t eat should come next. Composting is wonderful — you know I believe that. But in terms of nutrient capture, it is time to talk toilets.
Talking Toilets
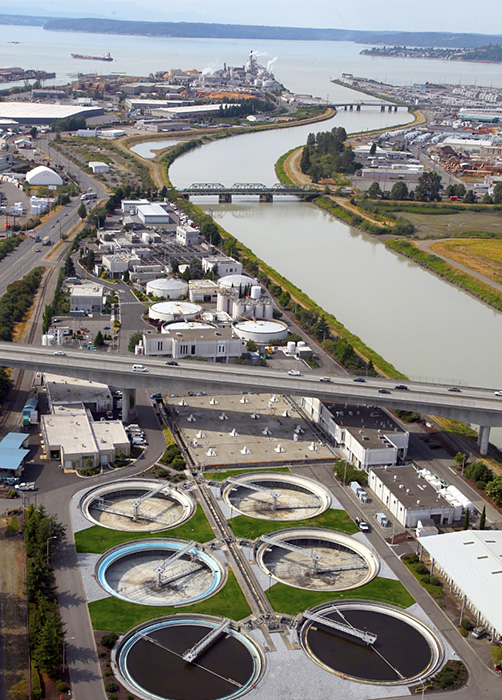
Wastewater treatment plant photo courtesy King County, WA
Next stop is the sewer. While people in Seattle and Tacoma have access to in-sink disposal, we assumed that most of what goes down the drain is food of the ‘human-processed’ variety, aka #1 and #2. For estimates of just how much of each we make, we turned to a publication by Rose et al (2015). Granted, this stuff is my bread and butter but if you want to go deep on this topic, this is the paper for you. The authors provide a range in both quantity and quality of pee and poop. For high income countries (low parasites and plenty of protein), each person produces about 28 dry grams of #2 a day. Total N and P in that are about 7 grams of N, and anywhere from 0.35 to 2.5 grams of P. Weak bladder or not, full Nalgene bottle or not, each person pees about 1.4 liters a day containing about 11 g of N and 0.45 to 1.3 g of P. Over the course of a year that comes to about 6.6 kg N and 0.91 kg P per person per year. Those numbers are remarkably close to the amount of N (6.6 kg) and P (1.1 kg) we need each year to grow food. And it all goes down the sewer. Not too big a problem here for outreach and education on what bin to use.
Those are crude estimates and a lot can happen as our wastes make that long journey through the sewer pipes to the plant. Wastewater treatment utilities are required to measure what comes in and what goes out. Frequency of those measurements is decided by how big a particular plant is. The wastewater in Seattle is treated by King County, the county where Seattle is located. King County operates three relatively large plants. If you use a toilet or take a shower in Seattle, that goes to the West Point plant, the oldest in the system (Brown and Caldwell, 2019). It is a combined storm water and wastewater facility that treats about 540 million liters a day.
If you go in Tacoma, the wastewater goes to one of two plants, but all of the solids get treated at the Central plant (Dan Thompson, City of Tacoma). Tacoma is smaller than Seattle and the Central plant treats anywhere from 54 to 144 million liters a day. The secondary plant treats much less. The wastewater coming into the plant in Seattle has total N and P concentrations of about 50 mg liters (L) of N and 6 mg L of P. Nutrientsin the Tacoma wastewater vary ranging from about 20 to 50 mg L of N, and 1.4-6 mg L of P. By multiplying the concentrations of the nutrients in the influent by the amount of wastewater entering the plants, we estimated the total N and P coming into the plants each year.
Were our estimates of what goes into the toilet anywhere near what shows up at the plant? In Seattle, we were way under. That can be explained, at least partially, by the fact that almost as many people live in Seattle as come in to work each day. Flushing at your place of business is just part of doing your business. For Tacoma, our estimates were pretty close.
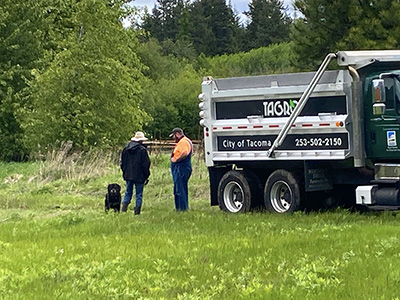
Delivery of Tagro for Sally Brown’s garden. Photo by Sally Brown
The plants also measure how much treated water goes out and the N and P concentrations in that effluent. The nutrients that get recycled end up in the biosolids — branded as Loop in Seattle and Tagro in Tacoma — are all used. That 100% beneficial use is much better than the nationwide beneficial use rate of just over 50%. Studies have shown that using these materials is a great way to sequester carbon, make soils healthier and grow more food. This is really something to be proud of. My own garden (we get Tagro delivered) tells the story. But if you look at the flows of nutrients, in particular nitrogen, the story has a way to go.
Fate Of The N & P
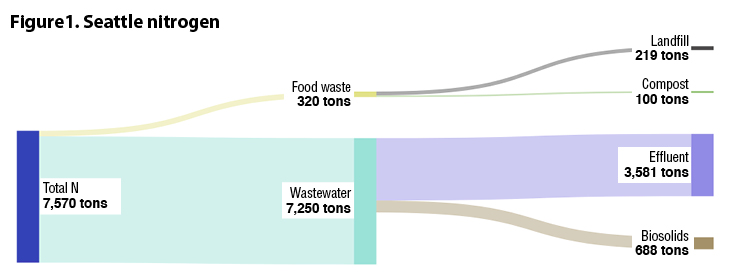
Figures 1-4 tally the flow of N and P from incoming food scraps and wastewater in Seattle and Tacoma. For both plants, only a fraction of the nitrogen that comes in the wastewater (influent) stays in the biosolids. Nitrogen, in mineral forms (think the urea in urine), is very soluble. When it is in organic forms (think of protein in food or feces), it sticks with the solids. Too much N comes into the plant to be absorbed by the microorganisms that eat the food and stabilize the solids. In Seattle, of the 7,250 tons of N that comes in every year only about 700 tons ends up in the biosolids. That is less than 10% capture. By our admittedly crude accounting, about half of what comes in goes out with the effluent. The missing 3,000 tons may be converted to nitrogen gas or may be an accounting error.
 The wastewater plants in Tacoma accept around 1,310 tons of nitrogen each year. Of that 370 tons ends up in the biosolids and around 1,000 tons end up in the effluent. I realize that these numbers don’t add up perfectly. Think of this as a flow approximation rather than numbers that you would give to the IRS. Both plants discharge their effluent into the Puget Sound. Both plants meet their permit requirement. The Washington State Department of Ecology is currently working with all of the plants that discharge into the Sound to reduce nitrogen loading. Whether that would mean more N capture and reuse or more N returned to the atmosphere is a really good question.
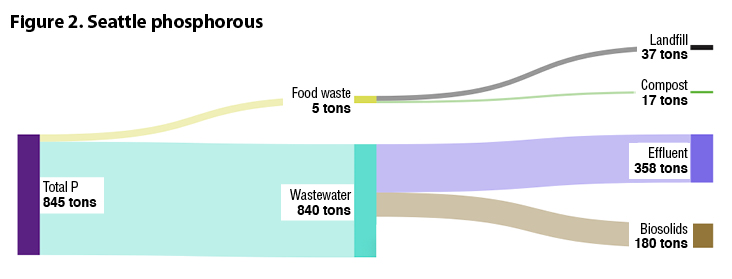
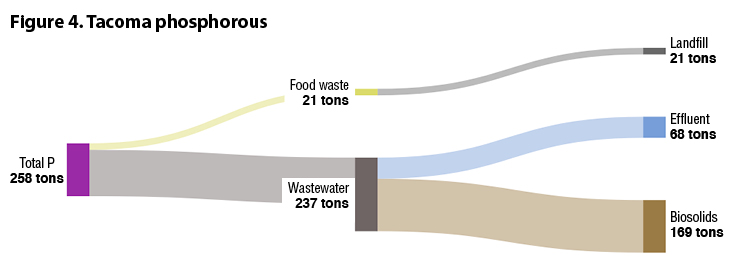
The story is much better for phosphorus. Of the 840 tons of P that comes into the WWTP in Seattle, 180 tons end up in the biosolids. The capture rate here is double that of nitrogen. The effluent gets about 360 tons (again, look at the trends and don’t try to balance the equation). In Tacoma, there is 237 tons of P in the influent and the biosolids gets 170 tons with only 68 tons discharged to the Sound. That is a kind of new math that I can really support. It is about 83% capture of what we predicted based on population and pee and poop.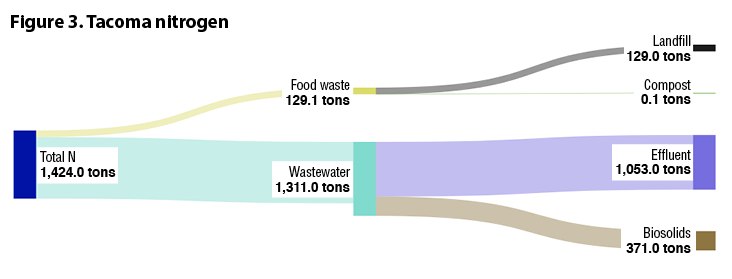
The good news in all of this is that just about enough N and P come into the wastewater plants to meet our needs to grow crops. The not as good news is that most of the N and a decent portion of the P flows right out. Capturing P is easy. Just add iron and your P will turn right into a rock. That technology has been used by multiple cities where excess P in effluent is a major environmental concern. It could also be used as a way to capture this essential nutrient. If you look in the literature there are a few papers on potential ways to capture that N (Zhang and Lui, 2021). None of them is a slam dunk and many of them mean more biosolids. Ask any wastewater utility and that is the last thing that they want. But if they really want to consider themselves as resource recovery facilities and if we really want to capture the nutrients we need, that is exactly what we want.
Sally Brown, BioCycle Senior Adviser, is a Research Professor at the University of Washington in the College of the Environment. Part III digs into use of captured N and P in urban food production.