Top: Ohio farm images courtesy Ohio Department of Agriculture
 Sally Brown
I have written and written some more and written again about PFAS and biosolids. Apparently and unfortunately, I am not quite done with this just yet. With the draft of the U.S. Environmental Protection Agency (EPA) risk assessment and the drastic change in direction of the EPA with the Trump administration, it is highly unlikely that conservative limits on PFAS in biosolids will be adopted at the federal level at this time. Many states have reacted by deciding to do the draft risk assessment one better and write their own limits. Maryland had some proposed, Texas was talking about an effective ban and I am sure that there are others that can be added to that list.
One thing that the EPA risk assessment didn’t do was to put the risk for PFAS exposure associated with municipal biosolids into a real-world context. That is what I would like to do here. The people who wrote the assessment for EPA had one task and one task only — look at potential routes of exposure to forever chemicals from land application of biosolids. In the real world, PFAS is staring you in the face whichever direction you face. That is true whether or not biosolids are even a blip on your horizon.
To do this let’s pretend we live in Ohio, home to about 12 million people. It rains 37 inches (94 cm) each year. Some of that comes down as snow. There are 13.5 million acres (5.5 million ha) of farmland in Ohio with the average farm size being 181 acres (73.2 ha). Let’s start this by considering the potential for PFAS to get into soil.
Biosolids Production
According to the last biosolids survey led by the North East Biosolids and Residuals Association using 2018 data, there were 283,100 (256,824 Mg) dry tons of biosolids produced in Ohio. Of that, 4% or 12,517 tons (11,355 Mg) were Class A and eligible for use in home gardens and lawns. Another 93,390 tons (84,722 Mg) or 32% were used in agriculture as Class B. The remainder were either landfilled (35%) or incinerated (29%). This means that only 36% of the biosolids generated in the state were actually used. That is lower than the national average (53%) but much higher than Maine (0%) where PFAS really has taken its toll regulatory-wise, or Connecticut (5%) where they have no excuse.
I don’t know what PFAS concentrations are in Ohio biosolids but here we can use a recent study out of California (Lin et al., 2024). With domestic flow as the primary source of PFAS, the mean concentrations of PFOA and PFOS in biosolids were:
PFOA: 2.63 ppb (0.5-14.7)
PFOS: 13.8 (Below Detection (BD)-49)
It is very reasonable to ask that municipalities identify industrial dischargers and limit flow into their systems so that the sources of PFAS are our homes and nonindustrial operations (offices, stores and restaurants). That is my justification for using the Lin et al concentrations for this exercise. For its draft risk assessment, the EPA assumed that biosolids were applied at 10 metric tons per ha. Using that same estimate, enough biosolids were beneficially used in Ohio to apply to 8,472 ha or 0.15% of the farmed land in the Buckeye state. Another way to look at that, considering the size of the average farm, is that biosolids were applied to between 11 and 12 farms. A different way to think about that is to calculate how much PFAS was added to soil from biosolids application. Using the estimates for biosolids PFAS concentrations along with the tonnage applied you get a whopping total of:
246 g PFOA added to the soil in Ohio
1289 g PFOS added to soil in Ohio
PFAS Pathway To Soil Via Pesticides
It turns out that biosolids aren’t the only way that PFAS gets into the soil. Pesticides have recently been recognized as a major source of these forever chemicals with PFAS used in both the active and inactive ingredients. PFAS also leaches into these compounds from the packaging. I have not found PFAS analysis for all of the different pesticides that farmers can spray on crops but one study noted that for active ingredients approved in the last 10 years (as of 2024), 61% were organofluorines (PFAS precursors) and 30% were actually PFAS (Donley et al., 2024). Another paper listed the PFOS concentrations of a few pesticides including Malathion, a very common organophosphate pesticide (Lasee et al., 2022). Malathion contains 17.8 mg kg (ppm) of PFOS. It is sprayed at a low rate (about a pound per acre) and can be sprayed weekly during the season. I found a website that provides estimates of how much of this type of pesticide was used in each state in 2023, giving both a low and a high estimate. The low estimate for Ohio was 147,630 pounds (66,964 kg) and the high rate estimate was 477,866 lbs (216,756 kg).
Here I assumed that all of the organophosphate class of pesticides has the same PFOS concentration of Malathion. I also disregarded PFOA as the paper with the PFOS concentration didn’t report any other perfluorinated carbon concentrations. Using the estimates for total pesticides added and the reported concentration of PFOS in Malathion, I was able to estimate the total PFOS added to soil in Ohio in 2023:
Low estimate: 1,192 g PFOS
High estimate: 3,858 g PFOS
You can also estimate how much land got the PFAS. While Malathion can be applied multiple times during a growing season, for our exercise I have guesstimated a twice per season load. With that, the pesticides were applied to between 27,054 and 87,570 ha of ground or between 0.5% and 1.6% of the total farmland in Ohio.
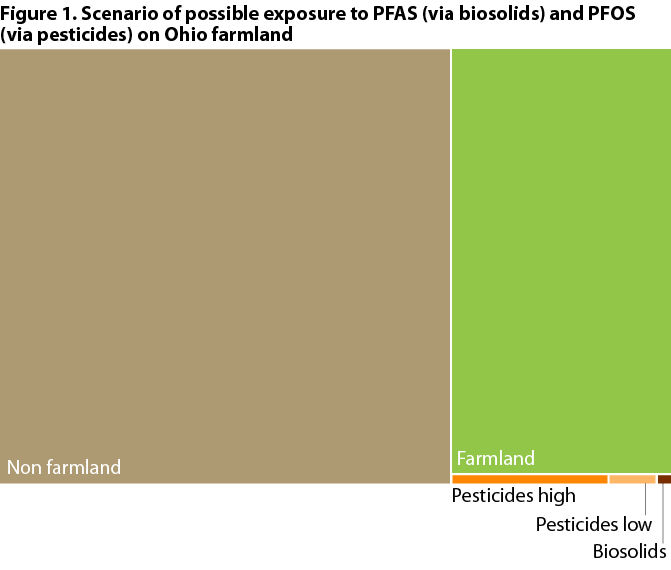
Figure 1 illustrates the results of this scenario in terms of possible exposure to PFAS and PFOS on Ohio farmland.
 Can’t Stop The Rain
Now farmers can choose whether or not to use biosolids and whether or not to spray their fields. But as the song lyric goes, “Can’t stop the rain.” A number of studies have quantified PFAS in rainwater, even going into detail on whether it falls more heavily during thunderstorms or steady drops. One study in particular looked at rain PFAS concentrations for several communities in Ohio (actually why I decided to focus on the state) (Pike et al., 2021). In that paper, the authors found multiple types of PFAS in the rain. In a follow-up paper that used a different type of analysis, the authors found orders of magnitude more PFAS by considering newer compounds and precursors (Kim et al., 2023).
Using EPA’s draft risk assessment calculations for PFAS, the amount of biosolids beneficially used in Ohio amounts t0 0.15% of the farmed land in the Buckeye state.
For this I will only consider PFOA and PFOS. I averaged the concentrations of each of these across the 5 communities that the authors sampled and came up with rainwater concentrations of 2.6 ng L-1 PFOA and 5.2 ng L-1 PFOS. Both are relatively low numbers, with the caveat that the PFOS concentration is above the EPA drinking water limit. However, people don’t move to Ohio for the sunshine. Using the average annual rainfall, I estimated the quantity of PFOA and PFOS that falls from the sky each year. Per hectare it is lower than the biosolids and the pesticides:
PFOA: 0.24 g per hectare from rain each year
PFOS: 0.49 g per hectare from rain each year
But like I said, you don’t get to decide whether or not you’ll accept the rain. If you total that rainfall contribution across the 5.5 million ha of farmland you get a total rainfall associated PFAS loading to farmland of:
1,344,200 g PFOA (aka 1344 kg) on farmland
2,688,400 g PFOS (aka 2888 kg) on farmland
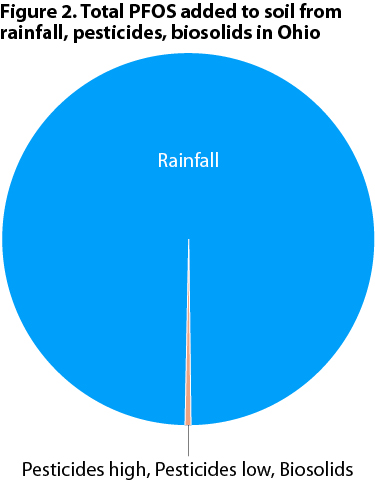 But one of the deals with this estimate is that while you only apply Class B biosolids to farmland and while the use of organophosphate pesticides is primarily limited to farmland, it rains all over. Even in Cleveland. The total land area in Ohio is 11.6 million ha, or a little more than double the farmland. That means that the total PFAS falling from the sky each year is more than double what falls on the farms (Figure 2). If those modelers at EPA had been tasked with relative risk and multiple sources of PFAS, not only would they be requiring that all farms go organic, they would be requiring irrigation with bottled water — except that has PFAS too. In other words, at least for Ohio, biosolids are only a tiny drop in the bucket when it comes to PFAS.
Lotta Zeros
Realize here that the PFAS concentrations I’ve talked about span a lot of zeros. This is the unit equivalent of Pappa Bear, Mamma Bear and Baby Bear on steroids.
- For pesticides, concentrations are reported in mg L-1 or 1 in 1,000,000 (million)
- For biosolids, that goes to mg kg-1 or 1 in 1,000, 000, 000 (billion)
- For rain, it gets even lower, to ng L-1 or 1 in 1,000,000,000,000 (trillion)
In Part II of this series, I’ll look at likely sources of PFAS to our diets, again with a focus on Ohio.
Sally Brown, BioCycle Senior Advisor, is a Research Professor at the University of Washington in the College of the Environment.