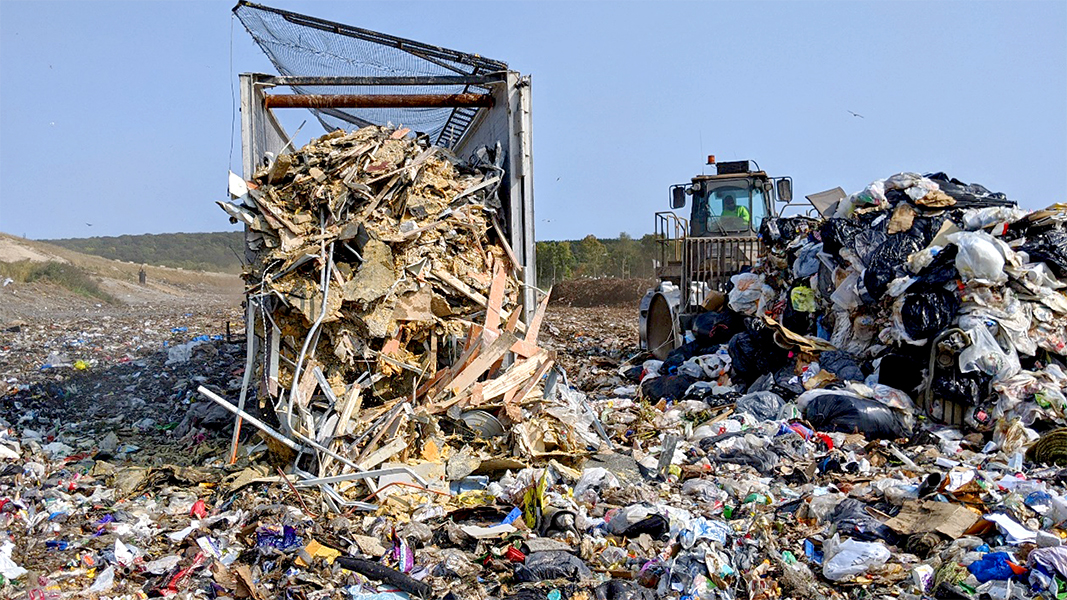
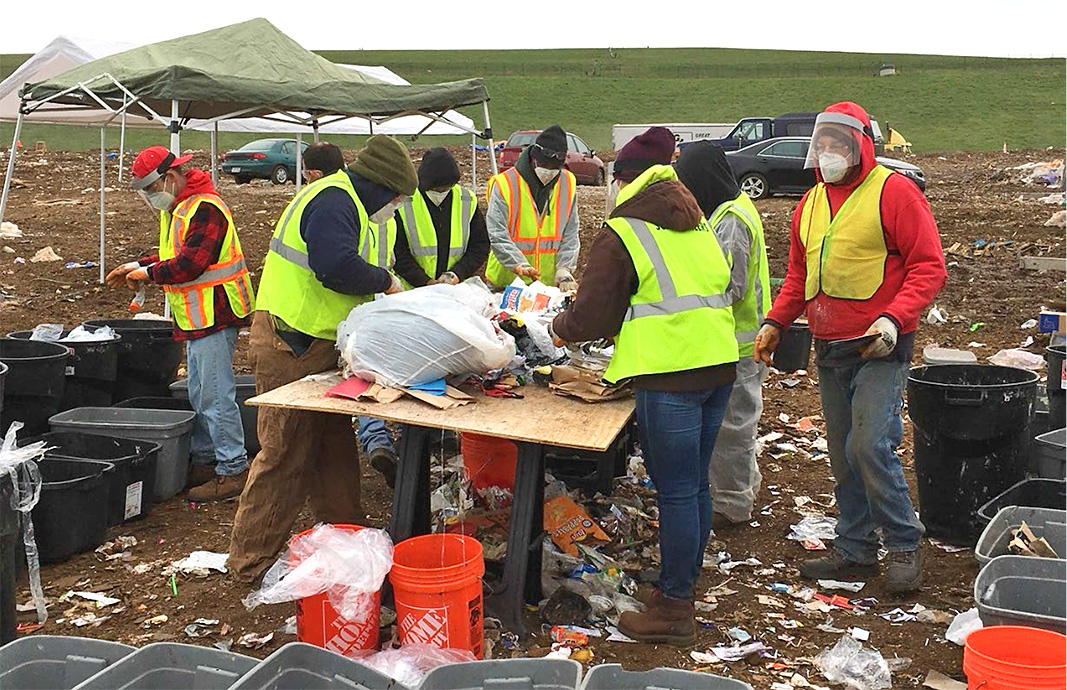
Top: Waste tipped for visual characterization study. Images courtesy SCS Engineers
Nora Goldstein
Last month, the Wisconsin Department of Natural Resources (DNR) released its 2020-2021 statewide municipal solid waste (MSW) characterization study. The analysis, which provides valuable insight into what is going into Wisconsin landfills, is “a powerful planning tool for waste reduction and minimization efforts,” notes Casey Lamensky, DNR Solid Waste Coordinator. The DNR contracted with SCS Engineers, an environmental consulting firm, to complete the study. Crews visited 14 landfills and one MSW transfer station around the state and hand sorted 398 samples of solid waste from residential and commercial sectors. In addition, SCS staff visually inspected 659 samples of construction and demolition (C&D) debris. Samples were sorted into 85 distinct waste components that were grouped into eight waste categories.
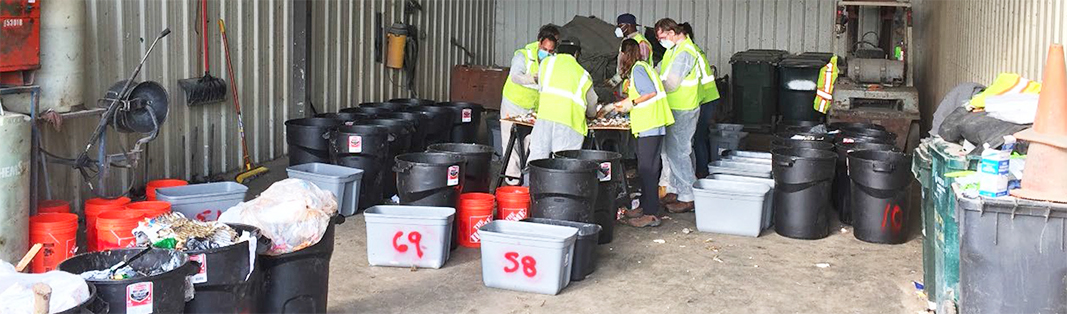
Sample containers are staged for sorting.
Sorting took place over two distinct periods, September-November 2020, and March-April 2021. While study results are likely affected by the pandemic, the two separate windows of data collection should help minimize the impacts of any particular event within the pandemic, according to DNR. “Because this study is a snapshot of Wisconsin landfills in 2020 and 2021, it should be regarded as representative of Wisconsin’s landfilled MSW within that timeframe,” explains Lamensky.
Organic wastes — materials such as food waste and yard trimmings — were the largest category of solid waste found in landfills statewide. “Specifically, wasted food, which is formerly edible food that was spoiled or discarded without being eaten, was the largest component at 14.5%, and inedible food scraps, such as banana peels, was the third largest at 6%,” says Lamensky. “Combined, these food wastes make up double the percentage found in a previous Wisconsin landfill study conducted in 2009. In addition to taking up valuable landfill space, disposing these materials contributes heavily to the production of methane, a greenhouse gas 28 times more powerful than carbon dioxide if released into the atmosphere.” She emphasizes adoption of simple steps that households can do to reduce wasting food, such as bring a shopping list to the grocery store to prevent buying in excess, store food properly to extend its life, understand food expiration labels and compost food scraps.
Data On Recyclables
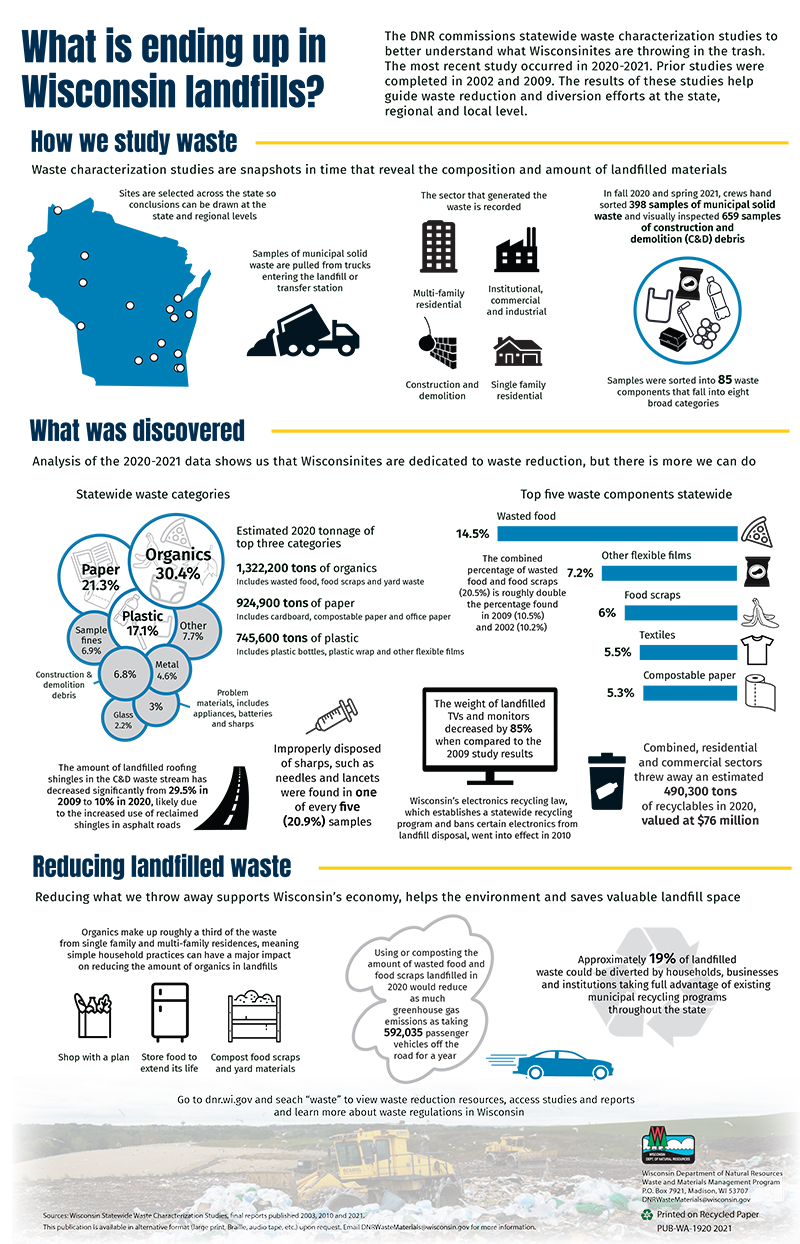
Infographic showing results from Wisconsin’s 2020-2021 waste characterization study
The waste characterization study results also indicate that the process of separating recyclables from the garbage bound for landfills could be improved. These are recyclables that were mistakenly put into the trash instead of recycling bins. The types that have increased in abundance in landfills since 2009 include No. 1 and No. 2 plastic containers, glass containers, aluminum and steel containers, cardboard, and office paper. Based on the results, the DNR estimates that in 2020, Wisconsinites threw away 490,300 tons of these recyclable materials with an estimated market value of more than $76 million. Currently, 754,000 tons of recyclable materials are processed annually and sent for reuse or recycling by facilities that manage residential recycling. Wisconsin’s statewide recycling law is designed to provide recycling access to all residential properties, businesses and institutions.
“We know from surveys that some people don’t recycle because they believe separated recyclables end up in the landfill,” notes Lamensky. “We want to encourage everyone to take advantage of their local recycling program. The recycling industry in Wisconsin is very good at getting these materials to buyers, so generally, once recyclables are placed in the recycling bin, they are not landfilled.”
Recycling successes are also identifiable in the data. In 2009, roofing shingles were the second largest material in the MSW stream and the largest in the C&D waste stream. Since 2009, recycling asphalt shingles, a process which consists of sorting out the roofing paper, grinding the shingles and remixing it in asphalt plants to be repurposed in roads, has become much more prevalent and the infrastructure has increased. Shingles no longer rank in the top 10 largest waste types for MSW and have decreased from 30% to 10% of the landfilled C&D waste stream.
Manually sorting MSW sample.
Organic Waste Details
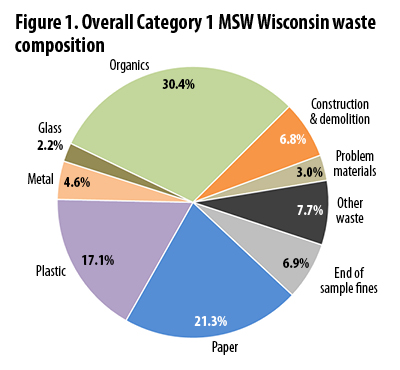 Figure 1 summarizes the overall MSW characterization findings; organics represent 30.4%, followed by paper (21.3%), and plastic (17.1%). By weight, wasted food is 615,500 tons, and food scraps (not traditionally edible) are 238,500 tons. Diapers are included in the organics (accounting for 154,400 tons); animal waste/kitty litter is 103,400 tons. Yard materials include 80,000 tons (<6 inches) and 8,400 tons (>6 inches). “Other” organic materials represent 88,900 tons.
Interestingly, in the paper category, compostable paper — defined as typically paper products that cannot be recycled, such as facial tissues and used paper plates — accounts for 232,000 tons of the total 924,900 tons of paper landfilled, the largest category of paper being disposed. Second highest is mixed paper (recyclable) weighing in at 223,300 tons. In third place is uncoated corrugated (recyclable) at 138,700 tons.
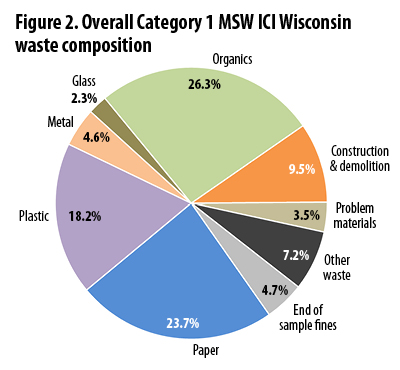 The data in Figure 1 summarizes the overall Category 1 MSW composition for waste materials disposed in Wisconsin. It represents aggregated MSW waste stream data for the single-family and multifamily residential sectors, and the institutional, commercial and industrial (ICI) sectors. When broken out separately, 33.8% of material disposed by the single-family sector is organic waste. For multifamily, organic waste is 31.5% of all waste disposed. Figure 2 characterizes the disposal data for the ICI sector. Organic waste makes up the largest percentage disposed (26.3%). Paper comes in a close second at 23.7%, followed by plastic at 18.2%.
The Executive Summary and the full Waste Characterization Study report can be downloaded at this link.