How a California city of 100,000, which generates about 25,000 tons/year (tpy) of organics, can fuel the solid waste fleet serving that community.
Rick Moore and Evan Edgar
BioCycle March/April 2016
California’s solid waste management industry is structured in such a way as to have all the necessary components in place for a successful transportation biofuel project — ability to be fully permitted, reliable feedstock supply, reliable demand for the fuel in line with storage capacity, ability to deliver the fuel to users, and ability to secure financing. There is also a high assurance that public investments will result in functioning facilities producing a renewable natural gas (RNG), a carbon negative fuel.
This project scenario was described in a White Paper, “Biomethane Transportation Fuel Production Powering the Solid Waste Sector Community-Scale Distributed Transportation Fuel Production Facility,” submitted to the California Energy Commission (CEC) in January 2016. It was prepared by Edgar & Associates on behalf of the California Compost Coalition and CleanFleets.net. This article is excerpted from the White Paper.
Community-Scale
The project development approach is deemed a “Community-Scale Distributed Transportation Fuel Production Facility,” where a population of 100,000 generates approximately 25,000 tons/year (tpy) of organic waste that can fuel the entire 35 vehicle solid waste fleet serving that community. Project economics vary significantly from project to project due to site-specific factors. The economics can result in a positive cash flow, but the return on investment is not necessarily attractive to private sector investors; state funding assistance is a desirable and appropriate way to commercialize and incentivize project implementation. The success of these programs will be anchored in having exclusive franchises in the community to collect source separated organics. These exclusive franchises guarantee the organic tons to provide the revenue streams to finance the composting and anaerobic digestion infrastructure.
There are approximately 12,000 waste collection vehicles and 3,000 transfer trucks still operating on diesel in California’s solid waste management industry. With an average use of 50 diesel gallon equivalents (dge) per day, the demand within the solid waste sector is 200 million dge/year, where there would be adequate on-site fleet demand within the industry. Additional RNG could be procured from landfills with an estimated potential of 417 million dge/year or wastewater treatment plants with an estimated production of 36 million dge/year, according to a recent University of California Davis study (Williams, et al, 2014). Fueling stations blending RNG and CNG also provide additional fueling capacity for the fleet demand. Note that the incremental cost differential between diesel and CNG heavy-duty trucks is about $40,000, and both the CEC and the California Air Resources Board (CARB) have been requested to consider funding the difference following the Hybrid Voucher Incentive Program model.
To transition California’s waste collection and trash transfer fleet from diesel to CNG with RNG fuel, the 15,000 truck fleet at $40,000 additional cost per truck, will add up to a $600 million investment, or $100 million for 6 years. To reduce petroleum use by 50 percent by 2030, the waste sector can take the lead as a closed-loop system where the fleet that collects the organic wastes gets fueled by the anaerobic digestion of the organic waste that was collected. Near-zero (NZ) nitrous oxide (NOx) CNG engines are coming out in 2016, e.g., the new Cummins Westport ISL G NZ NOx natural gas engine is the first mid-range engine in North America to receive emission certifications from both U.S. Environmental Protection Agency (EPA) and CARB. It meets California’s 0.02 g/bhp-hr optional NZ NOx Emissions standards for medium-duty truck, urban bus, school bus and refuse applications.
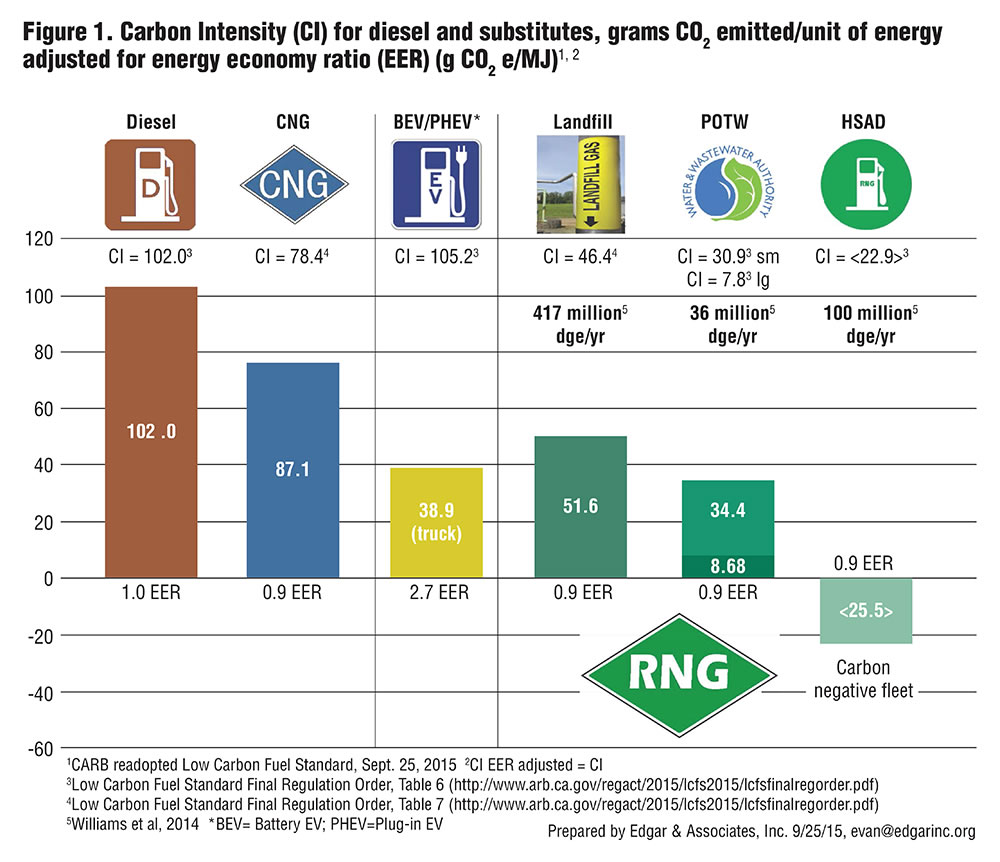
Figure 1. Carbon Intensity (CI) for diesel and substitutes, grams CO2 emitted/unit of energy adjusted for energy economy ratio (EER) (g CO2 e/MJ)
Using operational biomethane production and recovery rates, one collection vehicle delivering organics to an AD facility will provide enough Renewable CNG (RCNG) to operate three to four CNG vehicles at 40 dge/day. Essentially, the organic waste managed can provide sufficient RCNG to fuel the entire waste collection fleet that is collecting organics, recycling, construction and demolition debris, and municipal waste.
25,000 TPY Example
The cost estimates and fuel production capacity used in the White Paper are based on a dry fermentation (high solids) type of anaerobic digestion. Several facilities using Zero Waste Energy, LLC’s dry fermentation system are operating in California, ranging in capacity from 5,000 to 90,000 tons/year (tpy). An 11,200 tpy facility at Blue Line Transfer in South San Francisco is producing RCNG from organic waste to operate its waste collection fleet.
An AD facility with a capacity of 25,000 tpy is about the right size to serve a population of 100,000 people and is easy to site at an existing facility because of the footprint of less than an acre. The City Council of Napa (CA) recently considered and supported a 25,000 tpy AD project, which was awarded $3 million in funding support from the CEC. The initial capital cost estimate for the facility is $15.5 million, which includes AD bunkers, biogas purification system, fueling system and assorted ancillary equipment. Infrastructure costs for digestate management were not included as the AD facility is being colocated at an existing composting facility. Constructing composting capacity for an estimated 20,000 tpy of digestate using an aerated static pile (ASP) concrete bunker system is estimated at $2.5 million, which is considered best available control technology by local air districts in California. The cost of building, operating and maintaining the AD facility is balanced against project benefits such as avoiding the cost of purchasing the fuel elsewhere, revenue from LCFS credits and sale of RINs under U.S. EPA’s Renewable Fuel Standard, and several other avoided costs.
Facility costs, and the approach to economic analysis, vary depending on the scenario for the facility. Two possible scenarios include:
Scenario 1: An AD facility is colocated with a composting facility under common ownership. The composting capacity may already be sufficient to handle the digestate, and would have been used for the raw feedstock if the AD system were not in place. In this case, the costs for composting capacity would generally not be allocated to the AD project, but neither would the tipping fees associated with accepting the organic material, or the revenue from compost sales.
Scenario 2: A facility that is not colocated with a composting facility will have to pay to take the digestate to a composting facility and would not realize revenue from compost sales. However, in this case it would be appropriate to allocate the tip fee at the gate to the AD facility.
The Napa project is in the first scenario, where an AD facility is, in essence, being inserted into an existing facility between the gate and the composting area. The objective is to extract the biomethane from the putrescible waste before it is aerobically composted. Because there is an estimated 20 percent mass reduction during the AD process, only 20 percent of the revenue from the gate fee for the 25,000 tpy was allocated to the AD facility (5,000 tpy). Compost sales revenue is based on only 5,000 tpy of feedstock, reduced by 50 percent of the original mass. The idea is that the 25,000 tpy of feedstock could have gone directly to composting infrastructure, foregoing the methane energy benefit. By going through AD prior to composting, 20 percent of the mass is reduced, thereby increasing the amount of material that can be composted by 5,000 tpy.
A detailed pro forma was developed to analyze the project, which was amortized over a 20-year time horizon. Ongoing annual costs average $1.9 million, including debt service. Without the $3 million grant, the annualized project cost over 20 years, relative to no project and continuing to purchase fossil-based CNG at a local fueling station, is $320,000/year. Including the $3 million grant reduces the annualized cost to $170,000/year. To achieve a net present value of zero over a 20-year horizon, the grant amount would have had to be $6,250,000, or about 40 percent of the total estimated capital investment. The Napa City Council chose to support the project in spite of the cost increase over the status quo because it featured prominently in its sustainability and climate action programs and supported the food waste recovery programs that the City had put in place.
Note that if the facility owner is a private entity, the economics can change substantially due to tax implications. In the case of Napa, property tax would amount to an additional $170,000/year cost to a private operator. Additionally, grant funds are taxed as is any corporate revenue, reducing the “bang for the grant buck” for private companies. The graphic on p.50, Carbon Negative Fleet, provides a summary of some Napa system parameters.
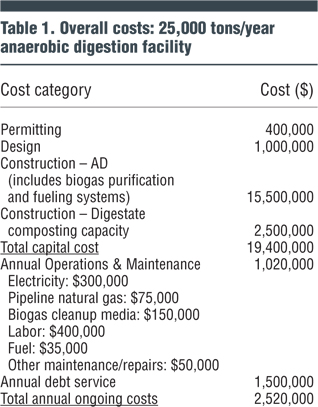
Overall facility costs are shown in Table 1 for a 25,000 tpy AD facility sited at an existing composting operation. Permitting consists of going through the state’s CEQA process, revising the solid waste facility permit, and obtaining a Permit to Operate from the Air District. Costs for digestate transport to a composting facility and tipping fees at the composting facility are not included in the operations costs because the cost to develop composting capacity is included in the capital expenditures. If digestate must be transported to a composting facility, operating costs can increase substantially. For instance, 20,000 tons of digestate transported at $15/ton, plus a $45/ton tipping fee is $1.2 million/year for a 25,000 tpy AD facility.
Rick Moore is Senior Civil Engineer and Evan Edgar is CEO at Edgar & Associates, Inc., based in Sacramento, California.
Reference
Williams, R. B., B. M. Jenkins and S. Kaffka (California Biomass Collaborative). 2014. An Assessment of Biomass Resources in California, 2012 – DRAFT. Contractor Report to the California Energy Commission. PIER Contract 500-11-020.
- 50
Carbon Negative Fleet
Community-Scale AD Facility 100,000 People
67% food/33% green
25,000 tons/year or 100 tons/day
Biogas production – 3,350 cf/ton – 60% methane
92% methane to RNG
330,000 diesel gallon equivalents (dge)/year
13 dge/ton
916 dge/day
Carbon negative fuel
Fleet
8 tons/load of organics
2 routes/day – 16 tons/day/truck – takes 6 trucks to AD
40 dge/truck/day and use 240 dge/day
AD makes 916 dge/day
Enough CNG to fuel the entire fleet of 35 that collects MSW, organics and recyclables