Compost blankets are very effective at “keeping rainfall where it falls,” helping to achieve maximum storm water volume reduction in tandem with bioretention cells and rain gardens. Part II
Britt Faucette
BioCycle October 2012
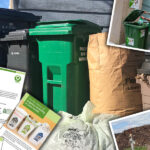
 have been developed to assist designers in using compost blankets as a storm water volume reduction management practice. These include vegetated blankets. (Photos courtesy of ERTH Products)")
Runoff curve numbers (CN) have been developed to assist designers in using compost blankets as a storm water volume reduction management practice. These include vegetated blankets. (Photos courtesy of ERTH Products)
Part I of this article, “Economic Case For Green Infrastructure” (August 2012), discussed how organics recycling, compost use and green infrastructure systems support the theory that the best designs were created by nature, and thus are worthy of mimicking. Use of green infrastructure tools has grown exponentially over the past 5 to 10 years, transforming storm water management practices. Now, however, Green Infrastructure and Low Impact Development gurus are undergoing a transformation of their own, which is visible in two notable ways: 1) The general trend toward volume reduction Best Management Practices (BMPs); and 2) Valuing the ecosystem services that these practices and designs provide.
The primary objective of Low Impact Development (LID) is to achieve predevelopment or natural site hydrology values for the postdeveloped site. In simple terms, LID is often described as a storm water management strategy that attempts to “keep the rainfall where it falls.” Designers can employ many elements to achieve this goal, but the sum of the parts should equate to reducing storm water volume (reducing peak flows, while important, is often seen as secondary to volume reduction), thereby minimizing off site discharges. Although reduced flooding and combined sewer overflows (CSOs) are often cited as the main reasons to reduce storm water volume, the real answer is that reducing volume is the most effective way to reduce pollutant loads.
Pollutant load (or mass) is calculated as the volume of storm water multiplied by the concentration of a given pollutant. Reduce the volume, reduce the pollutant. Eliminate the volume and there is zero pollution. No wonder the industry and regulators are moving in this direction! Treatment systems are obviously beneficial, in fact, many organic matter-rich soils act as natural biofilters and compost-based biofilters mirror this natural phenomenon with great efficiency. However, it is difficult for any treatment or filtration system to approach 100 percent pollutant removal. As we evaluate chemical, membrane or organic-based filters, it is extremely difficult to design for the wide variety of pollutants, pollutant concentrations and loads that humans (for the most part) have created. Advocates of ‘zero waste’ and ‘carbon neutral’ systems will likely appreciate ‘zero discharge’ systems as well, which can only be achieved by volumetric reduction of storm water.
Many LID experts are advocating for design guidelines based on watershed surface runoff curve numbers (CNs). A runoff curve number is the value attributed to a specific watershed surface area (rooftop, parking lot, lawn, pasture, forest) based on the percentage of runoff volume generated from the rain that falls on its surface. Impervious surfaces generate a high volume (and ratio) of runoff, relative to the rain that falls on its surface, and therefore have high CNs (98), relative to natural surfaces such as pastures and forests, which have lower CNs (39 to 80, depending on the underlying hydrologic soil group). Runoff CNs are routinely used in storm water volume estimates to appropriately size and design conventional storm water containment systems, such as ponds. Preservation of, and retrofitting with, low runoff curve number watershed surfaces has long been a leading element of LID design.
LID and green building ordinances as well as green building rating systems have begun including storm water volumetric control parameters. The most widely used design guideline is to capture the first one inch of rainfall and prevent its runoff from leaving the site, which encompasses approximately 90 percent of all rainfall events for most regions. One inch of rainwater is approximately 27,150 gallons/acre. However, the requirement is to capture the runoff, not rainfall, therefore you only design for this volume if your average runoff CN is close to 100, meaning your drainage area is represented mostly by impervious surfaces. Lowering the runoff CNs will reduce the volume of storm water runoff, and therefore the size of the storm water pond or number and size of the bioretention cells.
A conventional storm water design may use a single large storm water pond to capture and treat storm water generated from a given site or drainage area; however, LID and green infrastructure programs favor small, distributed systems (bioretention/rain gardens) to capture the prescribed runoff to reduce storm water volume discharges (and pollutant loads). In fact, the Leadership in Energy and Environmental Design (LEED) green building rating and certification system awards a credit for this LID design strategy in Section 6.2: Stormwater Design: Quality Control. However, what is interesting is that although these LID practices keep storm water on-site, they actually do not prevent the generation of storm water runoff, or in simple terms, keep the rainfall precisely where it falls.
Compost Performance
Compost blankets have conventionally been used for erosion control on hill slopes, typically after land disturbance. Over the years research has quantified their performance, and from this quantification new engineering criteria have been developed to assist designers. The research has also shown how much rainfall is absorbed by a compost blanket BMP, thereby reducing runoff. This reduction of runoff has led to reduction of pollutant loading, and in some cases compost blankets have absorbed enough rainfall that runoff, and therefore pollutant loads, have been eliminated. This is keeping the rainfall where it falls — the definition of Low Impact Development. Employing compost blankets as the first line of defense to absorb rainfall and prevent runoff works in tandem with bioretention cells and rain gardens to capture and filter the remaining storm water.
Recent research highlights the ability of compost blankets to absorb rainfall and reduce storm water. Early evidence that compost may be useful in LID came from Brady and Weil (1996) when they reported the humus fraction of compost can hold up to five times its weight in water. Research conducted at the University of Georgia showed that a 1.5-inch thick compost blanket exposed to 3.1 inches of rainfall could delay storm water runoff by up to one hour relative to bare soil conditions on a sandy clay loam soil (hydrologic class B). Mean storm water volume over one year was reduced by 50 percent, and as much as 96 percent for single events (Faucette et al, 2005). In a follow up study at the same site, under multiple 4-inch accumulation rainfall events, compost blankets reduced mean storm water volume by 60 percent and retained an average of 80 percent of the total rainfall (Faucette et al, 2007).
Vegetation is established quickly in a seeded compost blanket, and completely fills in over time. (Photos courtesy of ERTH Products)
Similarly, research from Iowa State University reported that a 2-inch compost blanket exposed to 4 inches of rainfall delayed storm water runoff by 50 minutes and reduced storm water volume by 90 percent, relative to 6-inch topsoil applications and disk-tilled soils (Persyn et al, 2004). Research conducted at Texas A&M, for the Texas Commission of Environmental Quality, found 2-inch compost blankets exposed to 3.6 inches of rainfall reduced mean storm water volume by 35 percent (and as much as 67%) relative to clayey soils (Mukhtar et al, 2004). Meyer et al (2001) found that after seven rainfall events with 2-inch accumulations, compost incorporated at 40 Mg ha-1 in gravely clay loam and gravely sandy loam soils reduced mean storm water runoff by 77 percent, while the percent of total rainfall retained was increased from 64 to 94 percent.
Finally, a study conducted at San Diego State University evaluated 14 different slope stabilization practices under rainfall accumulations of 0.67 inches, 2 inches, and 4 inches. Compost blankets reduced storm water volume between 29 and 94 percent and generated less runoff than any other single management practice evaluated in the study (Faucette et al 2009).
Calculating Runoff Curve Numbers With Compost
From this body of research it is clear that compost applications can significantly reduce site storm water volume in an LID context. Runoff curve numbers have been developed from these data to assist designers in using compost blankets as a storm water volume reduction management practice. If specific rainfall and runoff volumes are known for a given watershed surface’s soil-vegetation complex, curve numbers (CNs) can be determined (Pitt, 1994). A CN of 55 has been developed for vegetated compost blankets applied to hydrologic soil group B soils in urban areas (most research has been conducted with group B soils). This curve number is similar to curve numbers associated with brush cover, meadows and some wooded areas — watershed surfaces areas designers typically try to preserve in green building rating systems and Low Impact Development programs.
From this data CNs have been extrapolated based on published book values for the remaining three hydrologic soil groups, including a value of 40 for hydrologic soil group A, 70 for hydrologic soil group C, and 77 for hydrologic soil group D. Hydrologic soil groups are typically defined by their water transmission rate. Hydrological soil group A has rates greater than 0.30 in/hr (typically sand, loamy sand, and sandy loam); soil group B has rates between 0.15 and 0.30 in/hr (typically silt loam or loam); soil group C has rates between 0.05 and 0.15 in/hr (typically sandy clay loam); and soil group D has rates less than 0.05 in/hr (typically clay, clay loam, silty clay, sandy clay, and silty clay loam).
What do these lower runoff curve numbers really mean (aside from less storm water and pollutant loads)? To a designer it means a smaller storm water pond, or possibly fewer bioretention cells. To a developer it means less land area taken out of ‘production’ for storm water management, which can translate into more options for land use and development, typically ones that have a much higher value in the marketplace. To a regulator it means less pollution leaving the site. To a landowner it means lower storm water utility fees, less flooding, and potentially higher real estate values. To the rest of us it means cleaner water, a safer environment, lower costs (in dollars, energy, carbon emissions) to treat our water for the next user, and in some cases more fiscally sound municipal governments realizing tax collection gains from increased land values and lower water treatment costs.
Economic And Ecosystem Service Impacts
Having reviewed how compost blankets reduce storm water, the next step is to see what economic and ecosystem service impact this green infrastructure practice can provide relative to a gray infrastructure option (i.e., conventional storm water treatment such as a retention pond). A 10-acre development with a compost blanket (CN of 55), and design storm of 3-inch/24 hour period, will produce approximately 54,300 gallons of storm water. A site of the same size under impervious surface (CN of 98) and design storm scenario will produce 752,100 gallons of storm water. The increase in storm water volume discharge is nearly 1,400 percent or 697,800 gallons! Because pollutant loads are correlated to storm water volume, the increase in pollutant load generation is also nearly 1,400 percent.
If an on-site storm water management pond is required, the pond will need to be 14 times larger, taking away valuable real estate (in an urban environment this can represent a significant loss of revenue for the developer and have a negative effect on neighboring property values) and increase the cost to design, construct and maintain the pond. At $1/gallon of storage (in some areas this can be $3/gallon), the increase would amount to $697,800 to construct the larger pond (exclusive of the lost real estate value). At $50,000/acre, assuming a 4-foot deep pond, this represents a loss of 23,320 square feet (taken over by the larger pond footprint) or $27,000 lost in usable real estate — potentially income generating real estate. That equates to a total loss of $724,800. In high value real estate regions where pond construction is also higher (such as the Bay Area of California), this figure could be over $2 million.
If the storm water is to be discharged from the site, and into a combined sewer or storm sewer system, it will be treated by conventional means at a wastewater treatment facility or at some point downstream at a water treatment facility (after the increased pollution has entered a river, lake or stream). At 2 kWh/1,000 gallons of treatment, costing on average $0.13/ kWh, the increased energy and cost to treat the storm water from the impervious area would be 698 kWh — $91/year. And at 2 lbs of carbon dioxide emitted per kWh expended, the increase in carbon emissions would be 1,396 lbs of CO2/year. The full cost of water treatment and conveyance back to users has been estimated to be as high as $0.26/gallon, usually paid for by taxpayers.
All told, the total cost increase to treat the elevated storm water volume would be $181,428/year. This figure does not include the increased likelihood of flooding and resultant destruction of property, increased likelihood to contribute to a CSO event leading to additional water pollution, fines and cleanup costs, increased soil erosion, habitat destruction of receiving water bodies, potential roadway safety issues, or the cost difference in materials — any of which can be substantial. According to the U.S. National Oceanic Atmospheric Administration, flood damages account for $7.8 billion in damages every year (NOAA, 2012). Perhaps compost-based green infrastructure programs could lower this bill as well.
This article has focused on compost blanket applications simply because there has been a body of research literature evaluating their performance. Research is needed on how compost affects the performance of other green infrastructure applications, such as bioretention systems (rain gardens), bioswales, engineered soils, tree boxes, filter strips, infiltration trenches, biofilters and others. This needed research will lead to engineering and design criteria development, the ability to properly value these practices as ecosystem service providers (or enhancers), and to calculate the true life cycle cost (or benefit) of adding organics to these green infrastructure systems.
A recent survey of water industry professionals reported that new technologies to improve treatment effectiveness and efficiency will be the leading area of growth and investment within the water industry in the foreseeable future (Wallis-Lage and Chevrette, 2012). This represents an amazing opportunity for organics and compost products in sustainable storm water management applications, as approximately two million acres of agricultural and forest lands are developed every year in the U.S. It is exciting to see how compost is currently being adopted into green infrastructure and green building programs, as both industries continue to advance in their applications, scope and market share.
Britt Faucette, Ph.D., LEED AP, CPESC, is an Ecosystem Scientist specializing in organic materials research, design, and use in green infrastructure, low impact development, and water quality protection applications. When he isn’t studying nature’s systems he is typically trying to spend time in them.