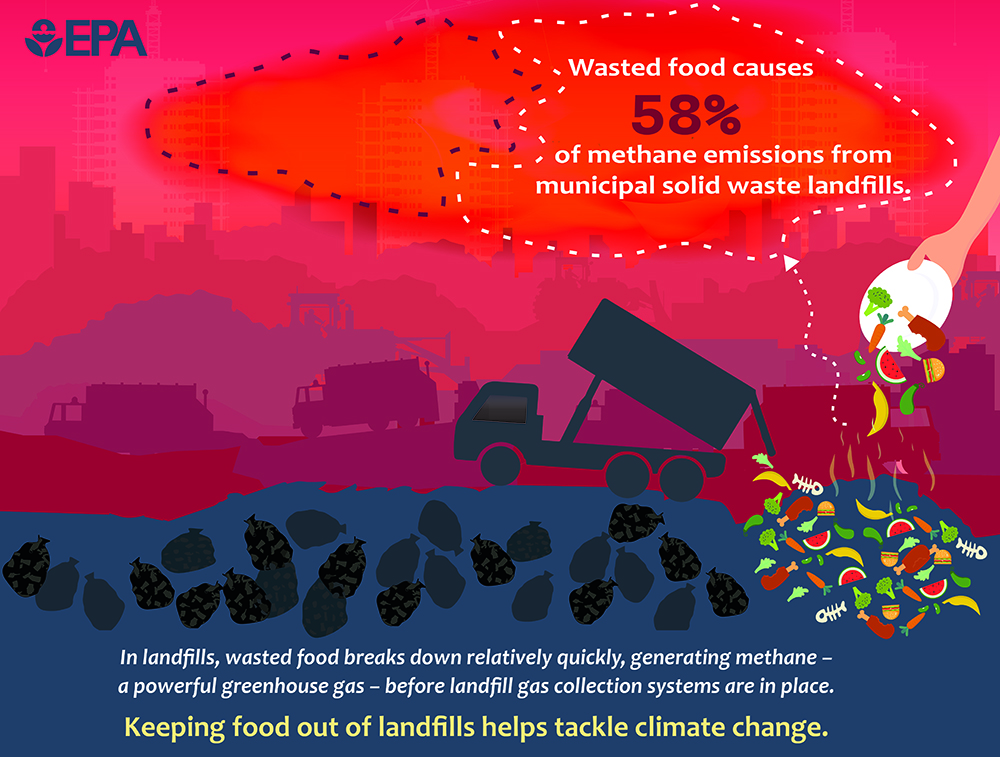
Top: New EPA report firmly states that landfilling food scraps generates huge amounts of methane, a majority of which is released to the atmosphere. Photo by Nora Goldstein
 Sally Brown
Over the holidays I went to see the Average White Band (AWB). This is a funk band from the 1970s. No new material but the way they put together the old stuff really brings down the house. One of their big hits from back in the day is “Pick Up The Pieces.” The U.S. Environmental Protection Agency recently followed suit. It picked up a bunch of old data and put it together for the first time in an October 2023 report called “Quantifying Methane Emissions from Landfilled Food Waste.” Assembled in one piece, in one report, it really packs a punch. Not so fun to read as AWB is to listen to, but it brings home a point. One that BioCycle has been screaming about for decades.

Average White Band. Photos by Sally Brown
Landfilling food scraps generates huge amounts of methane, a majority of which is released to the atmosphere. You may know this, anyone who reads BioCycle may know this but for the first time, in one place, EPA has said it. That is a gigantic and critical step towards fixing this problem.
Use Of Older Data
For its report, EPA took data on how quickly food scraps decompose from an old study by Morton Barlaz and used old estimates of the quantity of food scraps in MSW. It used estimates on methane generation from different landfills, took gas capture estimates from landfill operators, and utilized estimates of how much methane is oxidized (destroyed) by landfill covers. This is all old data, just like AWB’s “Cut the Cake” is an old song. But when you put it all together this is what you (and EPA) get:
- 58% of the methane from landfills comes from food waste
- 61% of the total methane produced is released to the atmosphere
- For each metric ton of food waste that goes into a landfill you get about 0.86 tons of CO2 equivalent (CO2e) released to the atmosphere as methane — effectively a 1:1 equivalent
- In 2020 landfilled food scraps released 55 million tons of CO2e to the atmosphere
Average White Band got the audience up on their feet and this summary should get municipal officials, solid waste program managers and people that generate food waste (i.e., everybody) ready for action as well. This is very powerful and very important. I would argue that it would be even more dramatic if EPA had used more current and realistic data.
Decay Rate Example
Here is what I mean. The decay rate is an estimate of how long it takes for something to decompose. The larger the decay rate, the faster the material decomposes. The decay rate is basically what portion of the carbon in a material decomposes in a year. For this estimate the EPA used a decay rate of 0.19 for food waste. That translates to 3.6 years for a bag of wasted or rotten food to disappear. As a basis for comparison, grass clippings with a decay constant of 0.39 are half gone in 1.8 years and cardboard with a decay rate of 0.03 is half gone in 23 years.
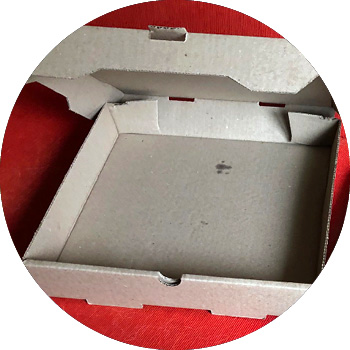
This is why the decay rate constant matters. In its estimate for methane (CH4) release, the EPA considered how long it takes for landfills to install and start up gas collection systems. In the first four years that waste is put in a cell, there typically isn’t any gas collection. That puts the efficiency at 0%. For the next four years, EPA has the collection efficiency at 50%. By using a decay constant of 0.19, half of the food waste will be gone before the collection system is up and running. The next half (or quarter of the original) will decompose with a 50% capture rate, next half or one-eighth of the original will decompose with a 75% gas collection efficiency. In contrast, those grass clippings will decompose about twice as fast. That means that half will be gone in 1.8 years and three-quarters of the original will be gone in 3.6 years or before gas collection is in place. The pizza box (cardboard) with a decay constant of 0.3 will barely have shown any sign of decomposition in the first four years with half gone after … 23 years.
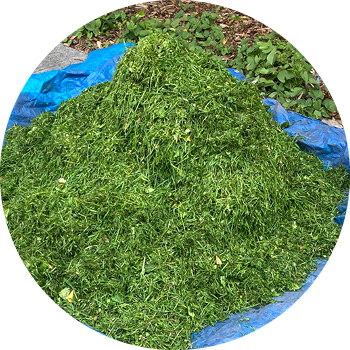
Grass clippings with a decay constant of 0.39 break down twice as quickly as food waste in the landfill.
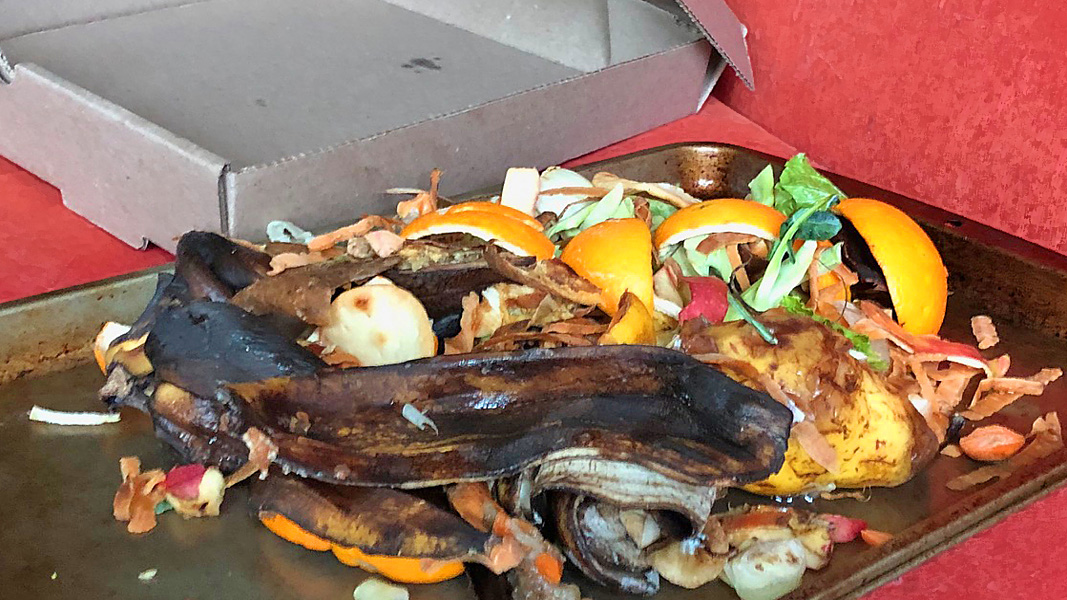
The question is: is your food waste more like the grass clippings or the pizza box? Another way to express this is what is the ratio of rotten fruit to take out containers in your food waste?
The data that EPA cites for this is from De la Cruz and Barlaz (2010). Looking at that paper, the methane generation potentials and decay rates that were used were taken from a much older study — one that has gotten my blood pressure up for over a decade (Eleazer et al., 1997). This 1997 report had cellulose concentrations in the food waste of 55.4%. Paper is made of cellulose. In other words, that 1997 study that EPA has based its new estimate on for food scrap decomposition rates and methane generation potential has food waste that is more than half old pizza boxes.
The 1997 study that EPA has based its new estimate on for food scrap decomposition rates and methane generation potential has food waste that is more than half old pizza boxes. Photo by Nora Goldstein
A much more recent study looked at characteristics of food waste to see if it would be appropriate to feed to pigs (Fung et al., 2019). For this study, the scientists collected food scraps from supermarkets, transfer stations, dining halls at a university, and source separated organics from households. All had moisture content greater than 60%. The authors tested for percent ash, crude protein, and fat. The food scraps were high in net energy (calories) in comparison to corn or soymeal. Phosphorus concentrations were similar across all sources. That suggests that the food scraps were high in food and low in cardboard. While the preconsumer stuff had higher nutritional value it was all suitable for use as pig feed.
This 2019 study is in contrast with the 1997 study. If we took the newer data and substituted the decay rate constant for grass clippings for the value EPA used for food scraps you would get much faster methane production. That translates into much more methane released as more than 75% of it would be gone before any gas collection started.
Climate In The Landfill Factor
This is just one of the issues with the old data used. Some of the others include estimates of how much methane is released and the climate within the landfill. The EPA used estimates for methane release and based methane generation in part on the area of the country where the landfill was located. If it was warm and wet outside, the EPA assumed that it would also be warm and wet in the landfill cell. That translates into high emissions. Warm and dry — you get lower emissions because methane production depends on high levels of moisture. A recent study out of California suggests that these estimates are another way that EPA has lowballed CH4 emissions (Duren et al., 2019). These guys took real-time measures of CH4 from all of the likely suspects including oil and gas, manure, wastewater and solid waste. Landfills accounted for 41% of the total methane that they found. This is in a state where landfill regulations are very strict and rain (except for last year) is a special event. At the time those measures were taken California was in the middle of a devastating drought.
You can and should celebrate this report from EPA. But you shouldn’t think that this is the end of the road. At this last concert, AWB announced that next year would be their last tour. It is not so easy to keep the house up and screaming in your mid-seventies. EPA does not have the same luxury. This report is a great start, a first of putting the pieces together to get an estimate of just how ugly the picture really is. As newer and more quantitative data is available, this should be a first step, not the end of the story.
Sally Brown, BioCycle Senior Adviser, is a Research Professor at the University of Washington in the College of the Environment.