BioCycle September 2010, Vol. 51, No. 9, p. 26
Minimizing materials handling steps and maximizing capacities of transport mechanisms are among the tools to increase profitability.
Craig Coker
CONTROLLING costs is key to making money (or staying on budget) in compost manufacturing, a volumetric materials handling activity. As such, the goal in designing a compost manufacturing plant is to ensure that, as much as possible, materials move efficiently through the manufacturing process. Efficiency means materials move in as linear a fashion as site constraints allow – from manufacturing step to manufacturing step with the least number of material handlings and in transport mechanisms of optimal capacity.
An example of a linear layout for compost manufacturing is shown in Figure 1. Layouts can be in a straight-line (as in Figure 1), U-shaped , V-shaped, L-shaped, etc. The important point is that materials not move counterflow, as that creates inefficiencies and risks cross-contamination of finished compost with raw incoming waste.
The manufacturing process has several distinct steps:
Feedstock collection: Separating feedstocks out and collecting/transporting them to the composting facility.
Feedstock preparation: Modifying feedstocks to make them suitable for efficient composting; for the most part, these are physical modifications like grinding or shredding of woody materials, or dewatering of liquid materials.
Feedstock mixing: Combining different ingredients as defined by the appropriate recipe to create a “compostables” mix.
Composting: Active biological decomposition of organic waste materials in the presence of moisture and oxygen.
Curing: Secondary decomposition step that reduces potentially phytotoxic compounds.
Screening: Physical modification to remove larger particles for product market aesthetic reasons.
Blending: Physical modification that combines compost with other components (fill dirt, sand, etc.) to make particular blends for specific markets.
Packaging/Shipping: Mechanics of moving the finished product to market.
Efficient materials movement also requires an optimal method of moving them from one step to the next. An economic reality in composting is that every time product is handled in the manufacturing process, a cost is incurred. Because the product is such a price-sensitive commodity, it is almost impossible to recover extra handling costs through price increases. One operational adage this author has heard is, “Nothing should move more than twice in its same physical condition.”
In addition to minimizing materials handling steps, it is also good planning to maximize capacities of transport mechanisms. In many facilities, this requires equipping front-end loaders with large capacity buckets (8 cubic yards (cy) or more). One composting facility uses a modified strip mine hauling vehicle to move 60 cy of compost at a time. The economics of this compared to a loader moving six 10-cy bucket loads one at a time was favorable when evaluated by this producer.
COMPOSTING EXPENSES
The expenses of a composting enterprise are similar to other typical manufacturing enterprises: there are fixed costs, like loan payments, and variable costs, like diesel fuel. The direct costs of composting are those associated with making the product (cost of bulking agent/amendment, loader maintenance, laboratory testing) and/or processing a waste material (collection container rental, collection route operating costs), while the indirect costs are overhead items like costs for starting the operation, marketing and sales expenses, human resource expenses, insurance costs and professional service fees.
Table 1 summarizes expenses common to composting operations, categorized by their function such as start-up, operations, product distribution and management and administration.
Operational costs include both direct and indirect costs. Making compost requires labor, fuel, equipment usage, electrical power and (usually) a carbon-based amendment/bulking agent. The financial statements for the composting enterprise will account for these costs as “Cost of Goods Sold” (COGS), which affects the gross profit of the enterprise.
Labor costs are the largest component of COGS. Labor is needed to prepare and mix feedstocks, build and monitor compost piles, move compost to curing, and to screen and prepare the final product for market. Labor costs attributable to the composting enterprise can be reduced by sharing those costs among other needs. If employees can be cross-trained to perform other functions (e.g. training a loader operator to monitor the process or training a truck driver to perform routine diesel equipment maintenance, etc.), then overall labor costs can be optimized. Cost of labor can range from $4 to $12/ton of feedstock handled, depending on composting method, equipment available and regional labor rates.
Fuel costs are often the second largest expense, as most equipment used to handle the materials of composting is diesel fuel-driven, and transport is often needed to bring feedstocks to the composting facility (and is almost always needed to take product to market). Transport costs have been escalating in recent years and hauling costs in late 2008 approached $4.50/loaded mile (i.e., a loaded truck traveling one way from point to point).
Trucking costs to bring feedstocks to a composting facility are often recovered from the generator as a separate charge from the material tipping fee, and are often subject to a fuel surcharge based on the current price of diesel fuel. Table 2 illustrates how a fuel surcharge works. Trucking costs to take product to market have to be absorbed in the cost of the product, which, given the markets’ limits on willingness-to-pay prices, puts a lid on the maximum cost-effective product delivery distance.
Equipment will have a need for regular and thorough maintenance, with its associated costs, as the abrasive and corrosive aspects of composting can wear out equipment faster than in other materials handling enterprises. Types of equipment used in composting are trucks, loaders, conveyors, turners, grinders, shredders, fans, screens, etc. In particular, hammermills on grinders and teeth on shredders can wear down rapidly, with associated high maintenance costs. Electrical power can be a significant cost, particularly if aerated static pile or aerated bin composting is used. Electrical power costs can be on the order of $1.05 to $1.50/ton of feedstock handled, depending on availability of three-phase power and electric utility rates.
Carbon-based amendments can be a significant operating expense. If the facility is located in an area where there is a demand for wood-based industrial boiler fuel, costs for materials such as sawdust can reach $25/ton plus transport. Some composters look to vegetative waste materials to serve as both carbon source and structural bulking agent. These are often available for minimal cost (sometimes free with only the cost of hauling), and include ground or unground municipal yard trimmings (leaves, grass and brush), chipped woody debris from clearing operations along utility rights-of-way and ground vegetative debris from land clearing operations. These types of woody wastes are not as sought after by boiler fuel markets (due to higher moisture and dirt contents) as are clean sawdust, wood chips and wood shavings.
CONTROLLING COSTS
Controlling costs is best done by analyzing costs. This begins with calculating machine rates for each piece of equipment used in the manufacturing process. A machine rate is an hourly cost of owning (or leasing) and operating a piece of equipment. The objective in developing a machine rate is to arrive at a figure that represents the cost of the work done under normal operating conditions. The machine rate consists of fixed, operating and labor costs. Fixed costs include equipment depreciation, interest on the loan used to buy the equipment (or the monthly lease payment), taxes and insurance. Fixed costs do not vary with the amount of work the machine performs, so they must be spread out over the expected hours of work during the year and the number of years of expected machine life.
Operating costs vary directly with the rate of work, and include the costs of fuel, lubricants, tires, equipment maintenance and repair. As the amount and frequency of equipment repair is often unpredictable, annual average figures should be used. Labor costs include wages paid, fringe benefits earned and the cost of supervision.
Once machine rates are known, they can be applied to calculate the costs of each step of the manufacturing process by using an approach similar to time-and-motion studies. The time it takes for an employee to perform a function in the process is measured, then that data is used to evaluate alternatives to streamline operating costs.
Take, for example, a multifeedstock solid waste composting facility handling about 85,000 tons/year of industrial and commercial residuals. Three rubber-tired loaders are used for materials handling. Each has a different capacity bucket – 4 cy, 6 cy and 9 cy. The operators thought more loaders would be needed as they wanted to be able to handle about 2,800 cy/day through the process. Management wanted to know what size loaders should be purchased in the future to achieve the lowest operational cost. They thought it took the main site operator about 6 hours to build a windrow with the 9 cy bucket and about 3 hours to tear it down and move compost to screening. They wanted to be able to build two windrows each day and move two windrows to screening, with each windrow holding 470 to 475 cy of material (or a total of 945 cy/day of material).
In 2008, management looked at the capital and operational costs of various sizes of loaders, in combination with their existing fleet. In the first analysis, the amount of time to perform the functions was assumed (i.e., not actually measured). Windrow construction was calculated at 6 hours/day/windrow (total of 12 hours/day or 720 minutes). Screening functions were divided into three parts (total of 6 minutes): Move material from unscreened compost stockpile (built by others) to screen hopper (assumed 2 minutes/bucket load); Move screened product from beneath screen to storage pile (2 min/bucked load); and Move screened overs from pile into 60 cy capacity truck for transport back to the composting pad (2 min/bucket load). Annual operations were based on 250 days/year.
Four bucket sizes were used in the analysis – 4 cy, 6 cy, 9 cy and 15 cy. Complete results of the analysis are available as a “Web Extra” on the BioCycle website (see box). Table 3 provides the annual cost summary. Given the reduced number of operating hours attributable to the use of larger buckets on the larger machines, the total costs per year were within one percent of each other for the three larger machines. Therefore, the decision came down to what was the best capital cost offer on the loaders.
Suppose instead management had actually measured the time it actually took to build and tear down windrows. Assume it takes 3 minutes (round-trip) to pick up waste from the storage pile and move it into place on the windrow base. Assume it takes 4 minutes to pick up one bucket of a finished windrow and transport it to the screening area. Table 4 shows the result of this analysis. The economic benefit of materials handling with larger-capacity buckets is obvious, even with higher machine rates.
TIME-MOTION STUDY
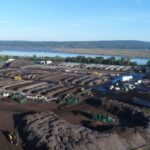
The City of San Diego’s (California) Environmental Services Department (ESD) operates a 690 tons/day composting facility on 75 acres at the City’s Miramar Landfill, known as The Greenery. The facility composts yard trimmings, woody residuals, food scraps from commercial sources and source separated drywall and pulverized paper from the U.S. Navy’s base in San Diego. In addition to compost, other products available include mulch and wood chips.
As the facility operates on top of a closed landfill, there are several unique issues at this site that can affect the efficiency of compost operations, including landfill gas collection heads and lines and uneven topography. According to Renee Robertson, Recycling Specialist with the ESD, the city recently received a new permit from CalRecycle (formerly the state’s Integrated Waste Management Board), which allows the facility to double its incoming tonnage and expand to 75 acres. “Due to some of these difficult site-specific issues, the City asked me to conduct an operations study before we started to utilize the new space,” says Robertson. “I decided to do a time-and-motion study of our operations.”
Robertson developed a standardized recording sheet and 40 task codes to measure individual tasks in Greenery operations. Task codes were chosen for data recording for several reasons: given the multitude of simultaneous activities, it’s quicker to assign time to a predefined code rather than write out a description of operations; it can be difficult to completely segregate tasks; and it ensures consistent data recording. Robertson also developed a Field Collection Sheet (Figure 2) for recording her five-person team’s observations.
Field data was collected over a 1.5 month period and consisted of over 9,000 hours of observation. This data was supplemented with a snapshot of financial data, including rental equipment cost per hour, equipment operator salary (fully loaded with fringe benefits), cost of fuel, amortized cost of Greenery-owned equipment, yearly cost of fleet division equipment, and cost of water. This data and the field observations were used to calculate machine rates for the loaders, the grinder, the excavator and the screen. This was done for internal reasons, as The Greenery is not a separate cost center in city government.
Robertson took the labor costs and machine rates, applied them to the observed production volumes and calculated the City’s cost per cubic yard for each step in the production scheme. The percentage contribution of each production step to the whole operation – compost and mulch production – was summarized in two formats. The first (Table 5) is a weighted percent comparison looking at production costs of compost and mulch against the whole. The second format (Table 6) is a product cost profile, assessing the relative cost of each step in the production process (for each product). This method enabled Robertson to isolate fixed costs and variable costs and show that switching to more compost production would generate more revenue (due to the higher value of compost) without increasing costs too much.
Robertson notes this had been a very useful exercise. “The true benefit to this type of study and analysis is that it lends itself not to just the removal of ‘steps’,” she explains. “Knowing the true cost of each task allows you to focus on streamlining the most expensive tasks. This study has given us the ability to assess operations from a relational cost center, and given us informed decision making power.”
Craig Coker is a Contributing Editor to BioCycle and a Principal in the firm of Coker Composting & Consulting near Roanoke, Virginia (www.cokercompost.com). He can be reached at cscoker@verizon.net.
WEB EXTRA
Loader time needed to handle material for windrow building
| Bucket Size (cy) |
CY/
day |
Buckets/
Day |
Min/
Bucket |
Min/
Day |
Hrs/
Day |
FTEs
|
||||||
|
|
||||||||||||
| 4 | 945 | 236.25 | 3.0 |
720
|
12
|
1.6
|
||||||
| 6 | 945 | 157.5 |
4.6
|
720
|
12
|
1.6
|
||||||
| 9 | 945 | 105.0 |
6.9
|
720
|
12
|
1.6
|
||||||
| 15 | 945 | 63.0 |
11.4
|
720
|
12
|
1.6
|
||||||
Loader time needed to handle material for windrow tear down
| Bucket Size (cy) |
CY/
day |
Buckets/
Day |
Min/
Bucket |
Min/
Day |
Hrs/
Day |
FTEs
|
||||||
|
|
||||||||||||
| 4 | 945 | 236.25 | 1.5 |
360
|
6
|
0.8
|
||||||
| 6 | 945 | 157.5 |
2.3
|
360
|
6
|
0.8
|
||||||
| 9 | 945 | 105.0 |
3.4
|
360
|
6
|
0.8 | ||||||
| 15 | 945 | 63.0 |
5.7
|
360
|
6
|
0.8 | ||||||
Loader time needed to handle screening operation
| Bucket Size (cy) |
CY/
day |
Buckets/
Day |
Min/
Bucket |
Min/
Day |
Hrs/
Day |
FTEs
|
||||||
|
|
||||||||||||
| 4 | 945 | 236.25 | 6 |
1417.5
|
23.625
|
3.1
|
||||||
| 6 | 945 | 157.5 |
6
|
945
|
15.75
|
2.1
|
||||||
| 9 | 945 | 105.0 |
6
|
630
|
10.5 |
1.4
|
||||||
| 15 | 945 | 63.0 |
6
|
378 |
6.3
|
0.8
|
||||||
Loaders needs analysis
Note: This assumes each model type doing ALL the materials handling above.
|
Work to be done
|
||||||||||||
| Bucket Size (cy) |
Total/Min
Day |
Hrs/
Day |
Hrs/
Year |
Available
Hrs/Yr |
# FELs
Needed |
|||||||
|
|
||||||||||||
| 4 | 2497.5 | 41.6 | 10406.3 |
2500
|
4
|
|||||||
| 6 | 2025 | 33.8 | 8437.5 |
2500
|
3
|
|||||||
| 9 | 1710 | 28.5 | 7125.0 |
2500
|
3
|
|||||||
| 15 | 1458 | 24.3 |
6075.0
|
2500
|
2
|
|||||||
Note: This assumes each model type doing ALL the materials handling above.
Loaders capital cost analysis
| Bucket Size (cy) |
Ex. FELs Cost/Year
|
Used Mach. Cost/Year
|
New Mach. Cost/Year
|
No. Needed
|
Total Annual Cost
|
Cost/Hr/
FEL |
Cost/Hr | |||||||
|
|
||||||||||||||
| 4 | $13,139.16 | $26,808.48 |
1 exist, 3 new
|
$93,564.60
|
$12.48
|
$37.43 | ||||||||
| 6 | $27,155.52 |
$28,835.52
|
1 exist, 2 new
|
$84,826.56
|
$11.31
|
$33.93 | ||||||||
| 9 | $26,637.84 |
$41,474.40
|
1 exist, 2 new
|
$109,586.64 | $14.61 | $43.83 | ||||||||
| 15 | — | $53,259.72 |
$75,743.64
|
1 used, 1 new
|
$129,003.36
|
$17.20 | $51.60 | |||||||
Note: Cost per loader based on 2,500 hours per year per machine.