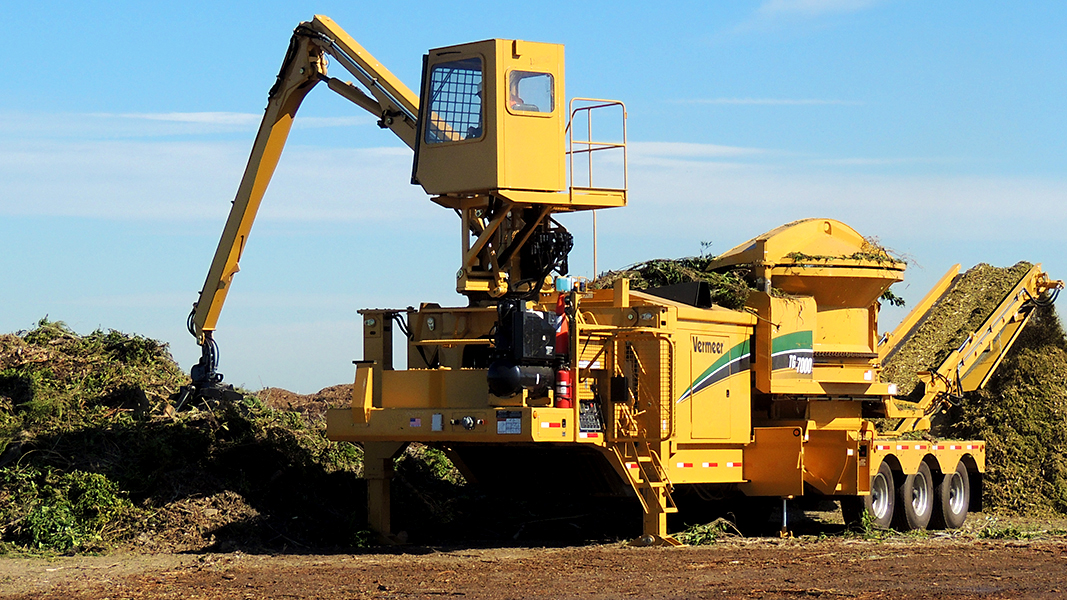
Top: Yard debris grinding in San Diego. Photo by Doug Pinkerton
Jeffrey Morris, Rich Flammer and Tyla Montgomery Soylu
The 2019 Compost and Mulch Market Study, conducted by Hidden Resources for the County of San Diego (California), found that the San Diego region is ill prepared to respond to requirements of the state’s SB 1383-Short Lived Climate Pollutants law (Flammer et al, 2020). SB 1383, which took effect on January 1, 2022, requires that 75% of organic discards, including food scraps and yard debris, be diverted from disposal by 2025. At the time of the study, the region was processing approximately 290,000 tons of organics at local facilities annually, with many at their operational capacities and unable to accept new material. To achieve 75% diversion by 2025, the region must divert an additional 1.25 million tons of organics to meet total processing demands of more than 1.5 million tons/year.
To achieve 75% diversion by 2025, the San Diego region must divert an additional 1.25 million tons of organics.
If this diversion is successful, the region will be producing anywhere from three to four million cubic yards of compost and mulch products annually (including compost-like digestate from new stand-alone anaerobic digestion facilities). Yet researchers identified a current market of approximately 670,000 cubic yards of compost and mulch. Even with an increased focus on market development, they identified a potential market of only 1.8 million cubic yards (or a little more than half of the volume ultimately produced) of compost and mulch. This leaves the region open to a potential surplus of compost and mulch. Not only is four to five times more processing capacity necessary to handle new diversion, the San Diego region requires substantial investment in local compost and mulch markets to create and meet demand for these new supplies.
The Market Study identified a tremendous potential for improvement and growth in the compost and mulch sales market in San Diego County. To fulfill this potential, public and private stakeholders representing multiple sectors must work together to advance investment in improved policy and industry-wide marketing programs. Otherwise, the myriad benefits of greater compost and mulch use simply cannot be realized.
One of the major recommendations identified in the Market Study was to develop the business case for compost and mulch utilization that takes into consideration a full life cycle analysis of using these products. The farming sectors are especially concerned about the combined costs of product purchase, transportation and spreading, and in general lack knowledge about the benefits of these products over both the short and long-term. San Diego County has some of the highest water prices in the U.S., yet compost and mulch are not being used sufficiently to retain moisture in the soil to help keep irrigation costs down. Soil health and erosion control experts interviewed for the study recommended doing a full business case analysis of using compost and mulch versus the far more prevalent conventional methods in practice. That recommendation led to the study discussed in this article.
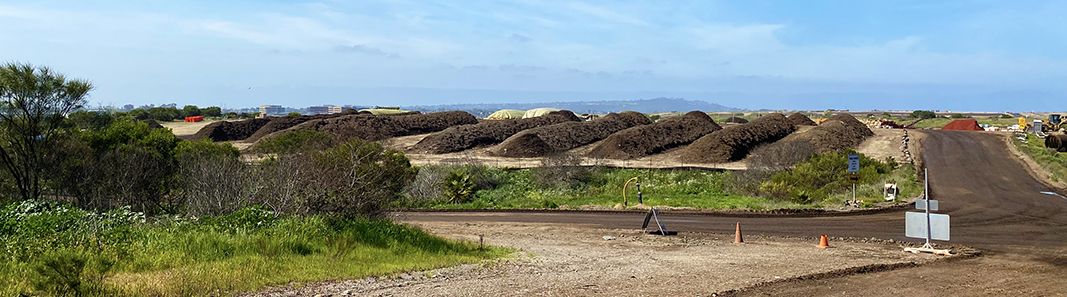
City of San Diego Miramar Greenery composting and mulch facility. Photos courtesy of Hidden Resources
Applying MEBCalc to San Diego County
There are many ways to manage biogenic material discards, including recycling into products, composting into soil amendments, grinding down the drain, burying, and burning. This study, commissioned by the City of Chula Vista Economic Development Department’s Office of Sustainability with some pro bono work from the consultant team, summarizes the reduced environmental impacts and resulting environmental economic value (EEV) of diverting food scraps and yard debris from landfills to compost. Results come from Sound Resource Management Group, Inc.’s (SRMG) Measuring Environmental Benefits Calculator (MEBCalc), parameterized for conditions and practices specific to San Diego County (Morris, 2021).
Compost applied to soils has many benefits, including improved tilth, water conservation, irrigational efficiency, carbon storage and enhanced sequestration, fertilizer and pesticide replacement, plant yield increase, and reduced pollution of surface and groundwater compared with fossil-based fertilizer nitrogen (N) and phosphorus (P) runoff. MEBCalc assesses nine environmental impacts, including climate change; three public health impacts (respiratory afflictions from particulates, maladies from exposures to toxics, and diseases from exposure to carcinogens); waterways eutrophication; acidification; aquatic ecosystems toxicity; stratospheric ozone depletion; and ground level smog formation (MEBCalc Version 7.1).
EEVs for the nine impacts are based on a review conducted for Oregon’s Department of Environmental Quality (DEQ) and Portland Metropolitan Area Oregon Metro, updated to 2020 dollars using the U.S. national average consumer price index (CPI) for all items (Morris, 2020). Summing the nine EEVs for yard debris and food scraps diversion from landfill to composting yields an overall environmental economic benefit for composting. This provides an augmentation to, and an environmental benefits perspective on, conventional financial calculations of profitability when using composts as substitutes for conventional synthetic fertilizers and pesticides.
Overall results assume a distribution of urban and rural uses for composts in San Diego County: 46.5% to homeowner use on gardens and shrubs; 10.5% homeowner use on established lawns; 5.0% homeowner use on new lawns; 12.0% use on roadsides; 25.0% use in agricultural applications; and 1.0% use by nurseries. This distribution is used to compute compost benefits from enhanced soil carbon storage and above ground biomass growth induced when compost displaces synthetic fertilizer.
Life Cycle Stages
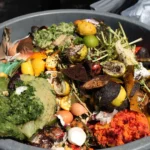
The life cycle stages for organic materials begin with generation and collection. A household or business generator places food scraps in a suitable container, perhaps along with landscape materials and soiled paper. That container is generator-hauled, or emptied into a contracted hauler’s collection truck, and transported to either a consolidation point such as a transfer station or driven directly to a composting or landfill facility. These facilities manage the materials by, respectively, processing them into marketable compost and mulch products, or burying them.
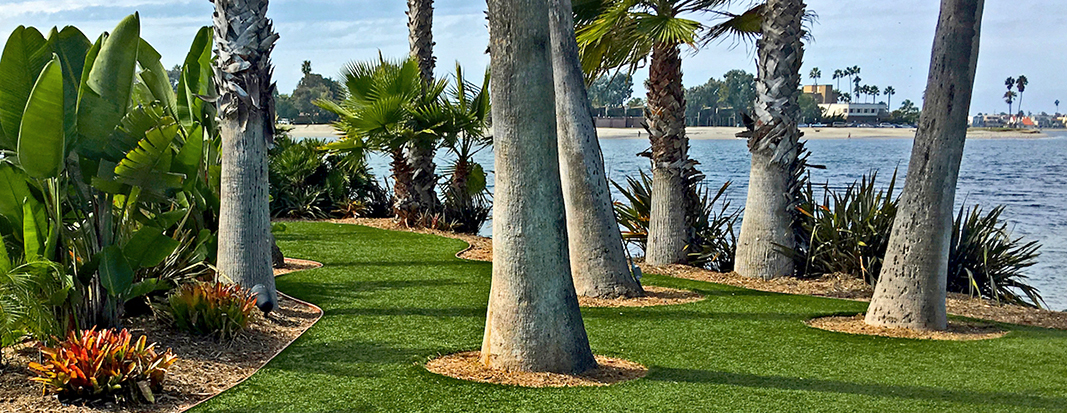
This study assumes that mulch is used mainly for weed suppression and is not incorporated into soils during use. Mulch application around trees and landscapes is illustrated above.
Purchasers use compost in a variety of ways — for example, blending them into agricultural or garden soils or top spreading them on lawns. Managers of landfills may capture and use some of the methane and other pollutants emitted from landfilling organics to generate energy, burn these pollutants in a flare, and/or let some or all pollutants escape from the landfill’s surface into the atmosphere. Thus, one of the benefits of diverting organic materials to composting is avoidance of pollution generated at the landfill, after adjusting for any decrease in societal pollution if the landfill energy is less polluting than other energy sources it displaces.
Additional benefits from composting occur when compost purchasers reduce their purchase and use of synthetic fertilizers and/or pesticides. This avoids pollution during the entire life cycle for these manufactured synthetic products. Their life cycles begin with extraction of material and energy resources from natural ecosystems. Then come resource refining, fertilizer and pesticide manufacturing, distribution of these products through wholesalers and retailers, use by their purchasers, end-of-life (EOL) management of any product leftovers, and transportation between life cycle stages for fertilizers and pesticides.
Compost life cycle environmental impacts are based on multiple national and local sources, mostly peer-reviewed, that take into account pollutant releases across the entire life cycles of organic materials and synthetic fertilizers and pesticides. Specific references and calculations are available via the link at the end of the article (Morris, 2021).
The organics, fertilizer and pesticide life cycle impact assessments also include several impacts from their use. The use phase is particularly difficult to assess. For example, “nitrate leaching and contamination of water bodies is a function of a combination of many complex factors, including N fertilizer rate and timing, rainfall, irrigation, soil type, depth of the aquifer and geology” (Powers et al, 2005). Similarly, phosphorus leaching and contamination of water bodies depends on, among other things, P fertilization rate and timing, and the same additional influences as indicated for nitrate leaching. Due to these complexities, the use phase assessment for organics, fertilizer and pesticide herein only covers surface water eutrophication from runoff of N as nitrates (NO3) and P.
Calculations for surface water eutrophication from N and P runoff that seem reasonably representative for synthetic fertilizers versus compost are based on the following:
- N equivalent content of applied fertilizer and compost = 1%
- P content of applied fertilizer = 0.8% (CARB, Table 8); P content of compost = 0.2% (Powers et al, 2005; Moeller, et al, 2018)
- Nitrate (NO3) surface water runoff rate = 24% of fertilizer N (Powers et al, 2005), and 14% of compost N (Nielson, et al, 2019)
- P surface water runoff rate = 3.2% of fertilizer P (USDA, 2006), and 0.01% of compost P (MN Compost Council, 2019)
Fugitive emissions of methane and nitrous oxide for composting facility operations assume a composting technology mix of 15% windrow and 85% aerated static pile (ASP) to reflect current and near-term-planned San Diego region processing ratios (San Joaquin Valley APCD, 2013; Climate Action Reserve, 2009).
Results: Advantage in Composting
Table 1 shows the pollution reductions associated with the substitution of one cubic yard of compost produced from yard and food discards generated in San Diego County for an amount of synthetic fertilizer containing an equivalent amount of nitrogen as that contained in one cubic yard (cy) of compost (data from various studies noted in Morris, 2021 reference). Table 1 estimates include environmental benefits from not landfilling the feedstocks used to make compost. Organic materials inputs and compost and mulch output estimates for San Diego County used in MEBCalc to compute the environmental impact reductions from compost or mulch use are, as follows:
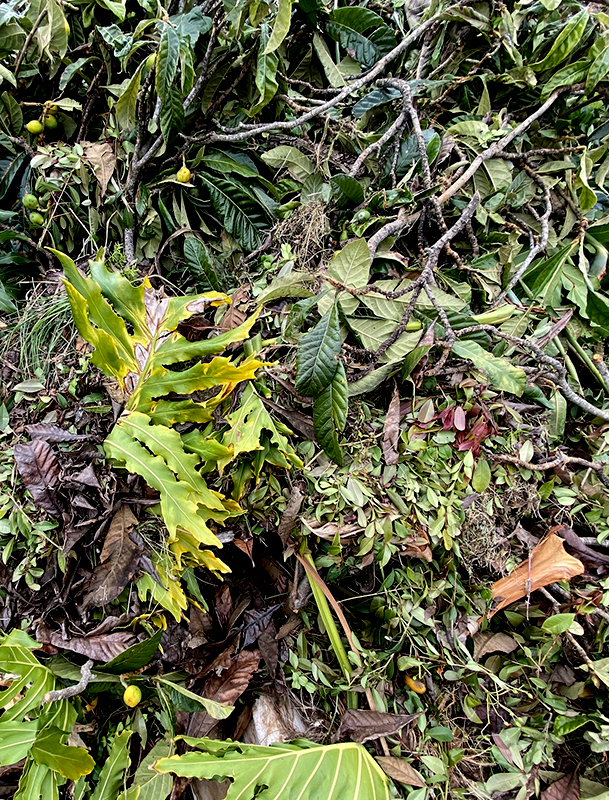
- Compost feedstock composition: Green materials-70% (composed of 90% leaves/grass and 10% prunings/trimmings) and food and paper materials-30% (composed of 80% food and 20% soiled paper)
- Mulch feedstock composition: Prunings/trimmings-60%, leaves/grass-28%, lumber-8%, and branches/stumps-4%
- Collected contaminants: 5% for compost feedstocks and 1% for mulch feedstocks
- Compost output by weight: 58% of incoming feedstock (excluding contaminants) totaling 1.45 cy/ton of clean feedstock at 800 lbs compost/cy
- Mulch output by weight: 100% of incoming feedstock (excluding contaminants) totaling 5 cy/ton of clean feedstock at 400 lbs mulch/cy
Each environmental impact shown in Table 1 is measured in equivalent metric tons of one particular pollutant’s emissions. This summarizes the effects of all pollutants that cause that impact. For example, climate change is summarized as metric tons of carbon dioxide equivalent (eCO2) emissions that are prevented or reduced by substituting compost for synthetic fertilizer and avoiding landfilling of compost production feedstocks. Particulate and particulate precursor emissions are summarized as metric tons of particulate matter 2.5 microns or less in diameter (ePM2.5).
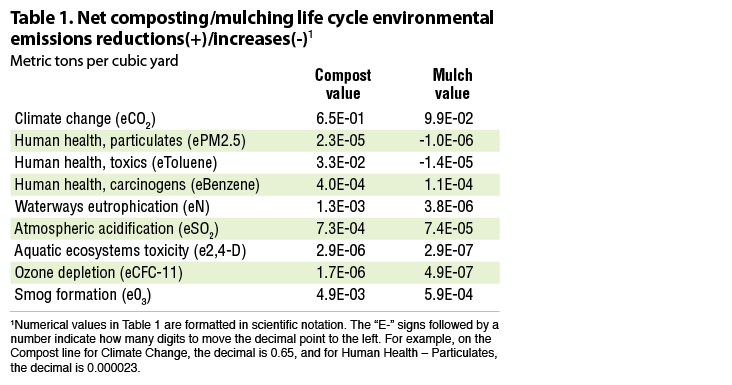 Table 2 shows results when each impact is monetized. As indicated on that table, climate change accounts for $139, or 69%, of the overall $200 EEV from using compost as a soil amendment which substitutes for synthetic fertilizers and pesticides. Waterways eutrophication reductions due to lower nitrogen and phosphorous surface water runoffs from compost account for $33, or 17% of total compost EEV; particulate pollution reductions account for $14, or 7% of total environmental value; and human toxics reductions for $11, or 6%, of EEV from replacement of synthetic fertilizers and pesticides with compost amendments to soils. Note that the $200/cy EEV for compost compares with the cost of compost purchase, transport and spreading reaching upwards of $60/cy (based on a price range for bulk compost sold in San Diego County between $10 and $25/cy).
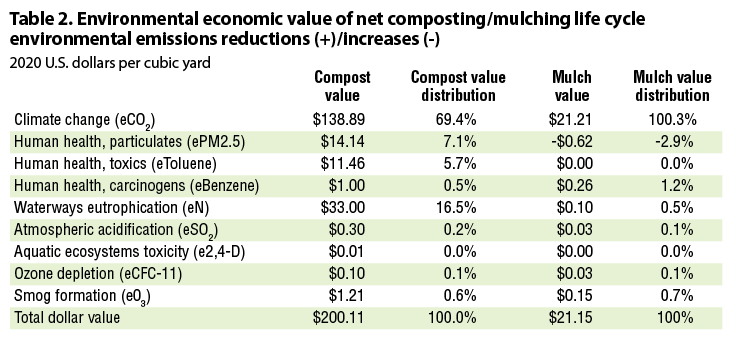
Tables 1 and 2 also show the environmental benefits when using mulch as a replacement for herbicides on roadsides and other areas where weed suppression might be desirable. It should be noted that much of the environmental benefits associated with mulching are due to avoidance of the environmental impacts of use of resources for, and manufacturing of, herbicides. The increase in environmental impacts for particulates is associated with chipping and grinding operations during mulch production.
This study assumes that mulch is used mainly for weed suppression and is not incorporated into soils during use. That is, mulch does not necessarily displace synthetic fertilizer production or improve soil productivity like compost does when incorporated into soils. Thus, mulching’s overall EEV is much smaller at $21/cy than compost’s EEV at $200/cy. Climate change benefits account for virtually all the net environmental benefits of mulch use.
Note that there is ample evidence that organic mulches do indeed improve soil productivity through addition of organic matter over time and enhancement of beneficial microbial populations. However, compared to compost, the soil benefits of mulch occur at a far slower, reduced rate. The researchers did not quantify these mulch benefits as part of this study but hope to do so in the next generation of the tool.
Takeaways and Next Steps
The Compost and Mulch Market Study identified that the majority of end users simply do not understand the benefits these products provide, or benefits perceived were overshadowed by their relatively higher upfront costs. These products are not being used to their potential, while environmentally, nutritionally and biologically inferior, less costly products continue to be favored. Conducting this life cycle analysis using MEBCalc provides the first step in understanding the true monetized climatic, human health and environmental values of compost and mulch use in the San Diego region. The study’s aim is that these calculated benefits will inspire jurisdictions within the San Diego region to develop data-driven policies and practices that prioritize use of compost and mulch over other conventional options to support local markets and aid compliance with SB 1383.
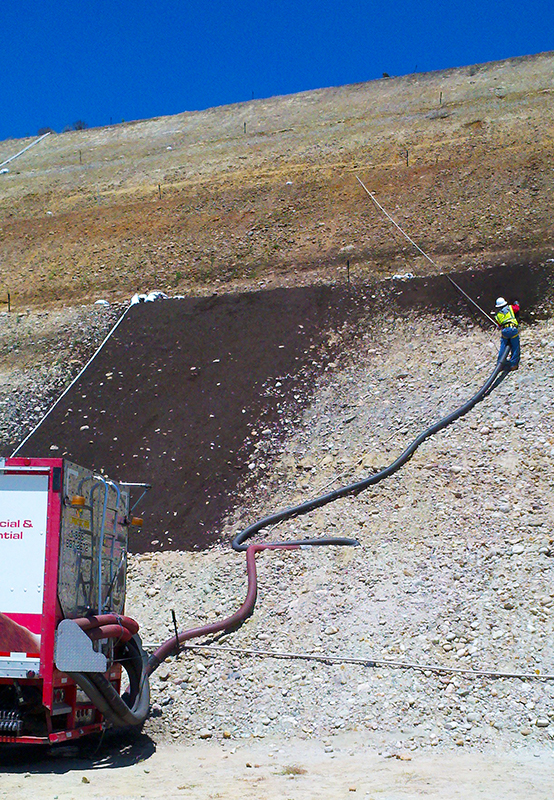
Mulch application for slope stabilization in San Diego County.
The next step will be to release a calculator tool that incorporates SRMG’s MEBCalc results as well as user-specific compost and mulch utilization information, including product volumes, purchase and use costs, and type of use such as soil amendment or surface cover. This cost benefits calculator tool will not only provide the monetized values from MEBCalc, but also consider values for water savings, cost reductions in synthetic fertilizers and herbicides, as well as operational and maintenance savings compared to conventional alternatives (such as in erosion control applications). Local jurisdictions could use the tool on a broader scale to support planning and policy. For example, a jurisdiction could enter their annual SB 1383 procurement target volume of compost or mulch to understand the societal benefits and cost value that procuring these products will provide. (SB 1383 includes a procurement requirement for jurisdictions.) End users also could enter project specific information to understand the net cost and value of using these products in their project, whether it be a farm, erosion control application, or other use.
MEBCalc and this proposed next generation tool will help fulfill one of the key recommendations of the Market Study and help propel the region into compliance with SB 1383. The business case for compost and mulch utilization, augmented by the environmental and societal benefits, will in turn anchor and fortify education, outreach and marketing efforts for the benefits of these invaluable products produced and used in San Diego County.
Jeffrey Morris, PhD-Economics, is with Sound Resource Management Group, Inc. (SRMG) in Carbondale, CO. Rich Flammer is with Hidden Resources in San Diego, CA. Tyla Montgomery Soylu is with Ekolojik, Inc.in San Diego. Additional information/endnotes from the study — including details on calculations and assumptions — are available in the final report.