Nora Goldstein
The U.S. Environmental Protection Agency’s annual municipal solid waste (MSW) “Facts and Figures” report has been a reference for tracking how MSW is managed in the United States for more than 30 years. Rebranded “Advancing Sustainable Materials Management: Facts and Figures” several years ago, the report provides data on the generation and management of MSW, including estimates of how much food waste in the commercial, residential, and institutional sectors is generated and managed by composting, landfilling, and combustion with energy recovery.
In 2017, the EPA set out to revise its food measurement methodology to more fully capture flows of excess food and food waste throughout the food system, and to provide more granular annual estimates of generation and management of excess food and food waste to the public. It released a Scoping Memo in July 2020, “Wasted Food Measurement Methodology Scoping Memo,” that describes the measurement methodology EPA has used to date, as well as the enhanced methodology that EPA developed between 2017 and 2019.
The enhanced methodology was used to calculate sector-specific estimates of excess food and food waste generation, as well as estimates of how much excess food and food waste was sent to each management pathway, for the year 2016. It also aligns with the Food Loss and Waste Accounting and Reporting Standard (or “FLW Standard”), which is a global standard that provides requirements and guidance for quantifying and reporting on the weight of food and/or associated inedible parts removed from the food supply chain (Food Loss and Waste Protocol, 2016).
Enhanced Generation Methodology
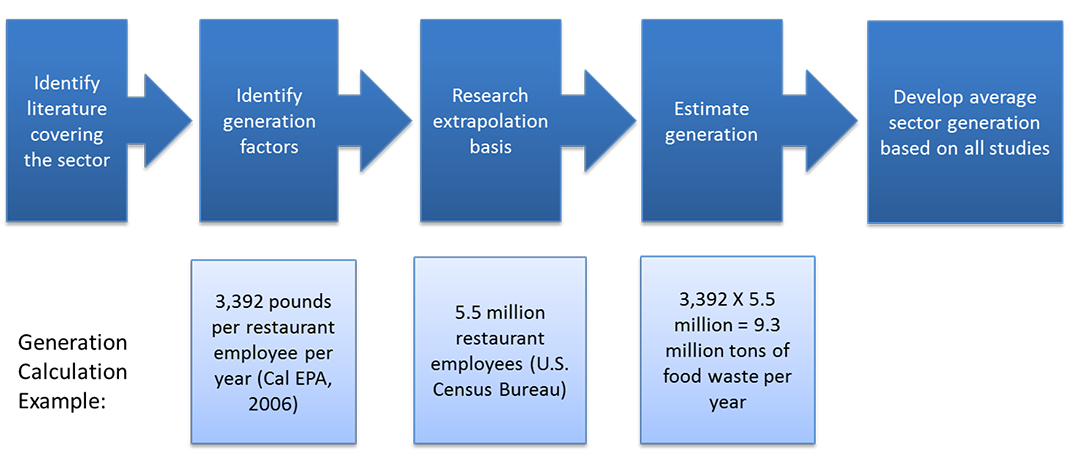
Figure 1. General generation estimation methodology
Figure 1 summarizes the steps EPA undertook to develop estimates of how much food waste was generated in the United States in 2016, and includes a sample calculation. Briefly, the steps are:
- Detailed Literature Search: Search focused primarily on literature published in or after 2007. The results provide the foundation for a series of detailed, sector-specific analyses that estimate annual quantities of food waste generation in the U.S. and trace current management practices.
- Identify Generation Factors: Generation factors are the quantitative parameters that allow estimation of food waste generation relative to a sector’s activity or size. For example, studies of residential food waste generation may frame the generation on the basis of annual pounds per household. Likewise, a study of generation at restaurants may frame the findings as annual pounds per restaurant employee.
- Establish Extrapolation Basis: Extrapolation is necessary to translate specific study findings into national food waste generation estimates. For example, a study of supermarkets in a given city may find that those stores generate 2 tons of food waste/ employee/year. That generation factor must be multiplied by the number of supermarket employees nationwide in order to develop a national level estimate of food waste generation. The number of supermarket employees is the “extrapolation basis.”
- Develop Annual Generation Estimates: Each generation factor was multiplied by the relevant extrapolation basis to obtain an annual food waste generation estimate for the sector.
- Average Generation Estimates: After developing the annual food waste generation estimate for each generation factor, EPA averaged these estimates together to arrive at a final, average estimate of annual (2016) food waste generation for the sector.
Adding Generator Sectors And Management Pathways
EPA’s enhanced food measurement methodology expands the scope of EPA’s previous food measurement by including industrial sources of food waste (i.e., food and beverage manufacturing/processing), and additional commercial and institutional generators of excess food and food waste, including supercenters/warehouse clubs, mobile catering, convenience stores, office buildings, military bases, sports venues, and food banks. The existing methodology included the residential sector; food retail/wholesale sectors; hospitality sectors, including restaurants/food services, hotels; hospitals, nursing homes, correctional facilities, colleges and universities, and K-12 schools. Figure 2 shows the percentage distribution of excess food and food waste generation (2016 data) based on the expanded categories of generators.
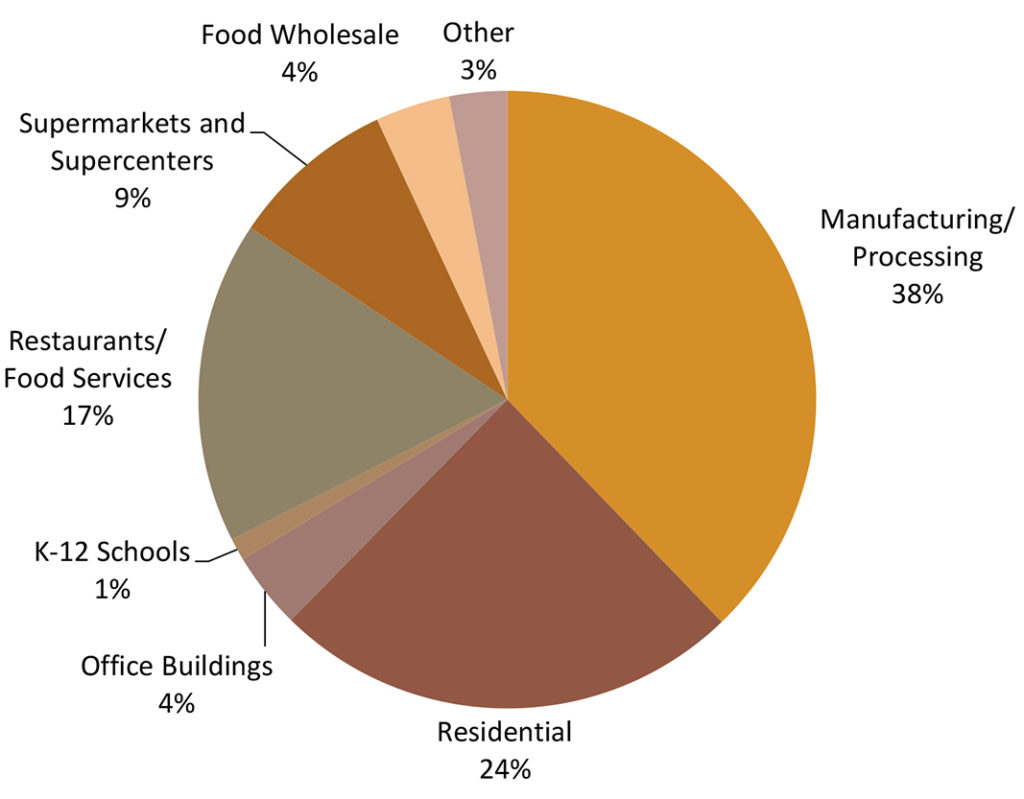
Figure 2. Percentage distribution of excess food and food waste generation (2016)
EPA’s food measurement methodology used historically for the “Facts and Figures Report” measures food waste at the point it is ready to be managed by the traditional MSW system (i.e., composting, landfilling, and combustion). This excludes food that is donated to feed people, used to feed animals, sent down the drain, or managed by other methods. Therefore, excess food and food waste that was managed by methods other than composting, landfilling, and combustion would not necessarily have been captured on the generation side of the estimate in EPA’s previous estimates. The enhanced methodology expands the scope and now includes: animal feed; biobased materials/biochemical processing (converting material into industrial products, e.g.,creating fibers for packaging material, creating bioplastics); codigestion/anaerobic digestion; composting/aerobic processes; controlled combustion; donation; land application; landfill; and sewer/wastewater treatment.
The manufacturing/processing sector accounts for 38% of generation (Figure 2). The largest generator in the commercial sector is restaurants/food services, which accounts for about 17% of generation, and the largest generator in the institutional sector is office buildings, which accounts for 4% of generation. Of that amount — based on the enhanced methodology — just over one-third was landfilled, approximately 20% was sent to animal feed, approximately 11% was sent to codigestion/anaerobic digestion, and approximately 9% was donated. The remaining management pathways, including composting, each account for 8% or less of total food waste managed (Figure 3).
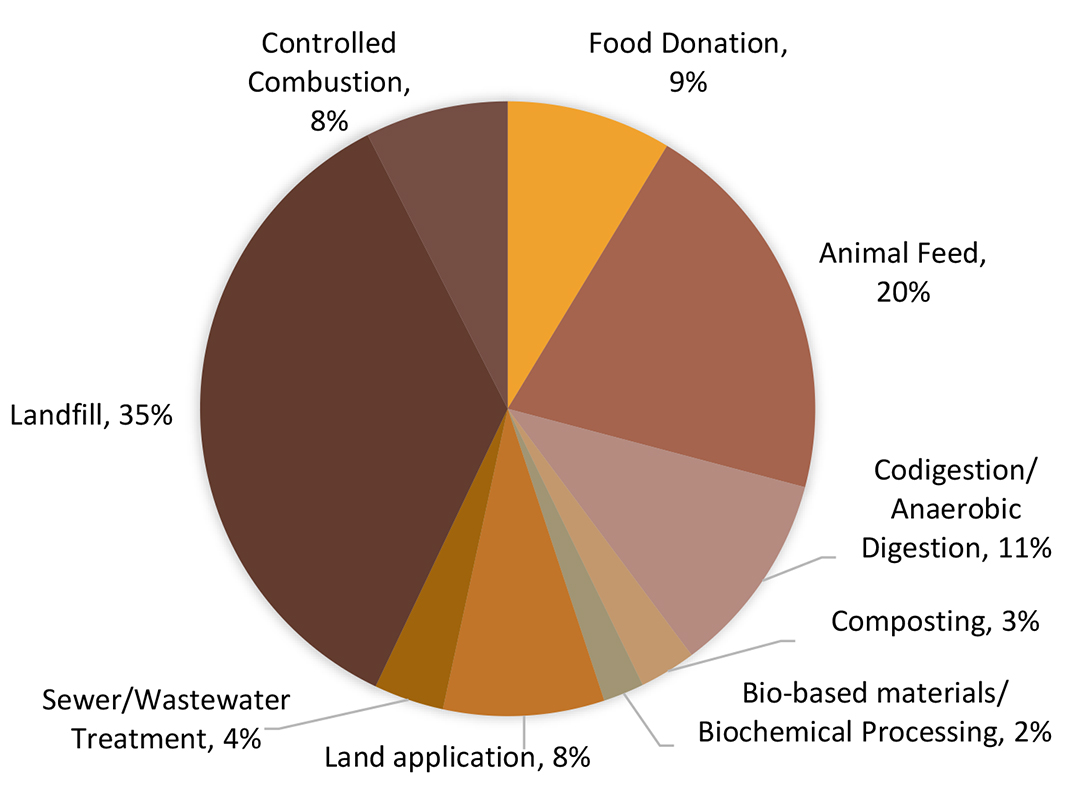
Figure 3. Percentage distribution of excess food and food waste management (2016)
Changes To “Facts And Figures” Methodology
Using the enhanced methodology, EPA estimates that in 2016, just over 100 million tons of excess food and food waste were generated in the industrial, residential, commercial, and institutional sectors. Of that, the industrial sector (food and beverage manufacturing/processing) accounted for 37.8 million tons of excess food and food waste. EPA will use the enhanced measurement methodology, with one exception, to derive updated estimates of excess food and food waste generation and management for the “Facts and Figures Report” starting with the 2018 estimates, which are anticipated to be published in late 2020. The exception is the industrial sector, because industrial sources of waste are out of the scope of the report, similar to how EPA measures but doesn’t include construction and demolition debris (C&D) in the annual “Facts and Figures” accounting.
The enhanced methodology will include excess food and food waste generation estimates for the residential, commercial and institutional sectors, and estimates of how much excess food and food waste is managed by the following pathways: animal feed, bio-based materials/biochemical processing, codigestion/anaerobic digestion, composting/aerobic processes, controlled combustion, donation, land application, landfill, and sewer/wastewater treatment.
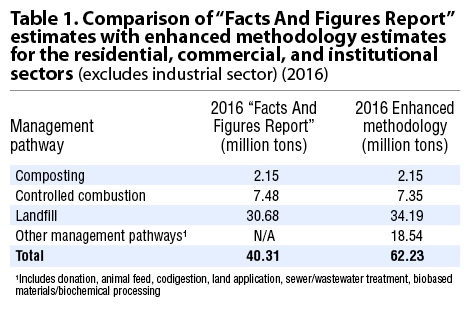
EPA compared the 2016 food waste estimates published in the “Facts and Figures Report” (U.S. EPA, 2019a) with the 2016 estimates developed using the enhanced methodology (excluding the manufacturing/processing sector). As shown in Table 1, for 2016, the enhanced methodology results in an estimate of 62.23 million tons of excess food and food waste generated in the residential, commercial, and institutional sectors, compared to 40.31 million tons of food waste generated in the 2016 “Facts and Figures Report” (U.S. EPA, 2019a).
Food Waste Composted Estimates
In the existing methodology, EPA estimated food waste composted based on summarizing state-specific data available from state environmental agency websites, published reports, and reported values from EPA’s State Data Measurement Sharing Program (SMP, a voluntary data alignment initiative). EPA did not extrapolate this data to account for activity in the remaining states, tribes, and territories for which no data were available. MSW composting — when single-stream MSW is collected and organics are sorted out for processing at the composting facility — was also included in the total composted estimate, and reflected production from all known sources based on published literature. EPA then subtracted the estimate of food waste composted from the estimate of food waste generated. This resulted in the estimate of total food waste that was landfilled and combusted with energy recovery.
For the enhanced methodology, EPA’s initial characterization of food waste management applied national percentage distributions to generation to estimate the quantity of food waste composted for each sector. To refine this approach, EPA explored the availability of data on composting facilities and the absolute quantity of food waste accepted at those facilities. The literature search identified 85 studies that discuss food waste managed by composting, but many of these studies are not directly useful to methods development. Some studies lack quantitative information on quantities and rates managed, while others provide point estimates of food waste managed by composting for a subset of generation sectors (e.g., retail).
Therefore, EPA used data available through state environmental agency websites, published reports, and reported values via EPA’s SMP, and summed the reported food waste composted tonnages from each state. The state-reported data yields a total of 1.8 million tons of food waste composted in 2016. EPA gathered information from 37 states but did not extrapolate to account for activity in the other 13 states or tribes and territories for which data are not available. EPA also estimated a quantity of mixed MSW that is composted annually (306,019 tons in 2016). In total, EPA’s dataset yields 2.15 million tons of food waste from the residential, commercial, and institutional sectors composted in 2016 (U.S. EPA, 2019a).
These estimates do not include food waste composted from various industrial sectors, such as food manufacturing/processing. To estimate food waste composted from the food manufacturing/processing sector, EPA used the results of surveys of food manufacturers regarding their excess food and food waste management practices that were conducted by Business for Social Responsibility and Food Waste Reduction Alliance (BSR, 2012,2013, 2014; FWRA, 2016). EPA averaged the percentage composting distributions from all the surveys conducted in 2013, 2014, and 2016 to capture variation in management practices across manufacturing/processing subsectors and applied this average composting percentage to the estimated quantity of food waste generated by food manufacturers and processors in 2016. Based on this analysis, EPA estimates that food manufacturers and processors composted approximately 820,000 tons of food waste in 2016.
EPA added the estimate of food waste composted by food manufacturers and processors (820,000 tons) to the state-reported composting estimate (2.15 million tons), to arrive at a nationwide food waste composted estimate of approximately 3.0 million tons in 2016. EPA’s estimate does not include backyard composting or community composting, nor does it include any quantities of food waste composted by states, tribes, and territories that do not report food waste composting tonnages, so it likely understates the total quantity of food waste managed by composting in 2016.
Food Waste Codigestion
To estimate the quantity of food waste managed through anaerobic digestion (AD), commonly known as codigestion, EPA’s initial characterization of food waste management applied general economy-wide percentage distributions of waste management to generation in each sector. To improve upon this approach, EPA explored available data on AD facilities and the absolute quantity of food waste accepted. The literature search identified 27 studies that discuss food waste managed by codigestion, but many of these studies are not directly useful to methods development. Some lack quantitative information on management quantities and rates, while others provide point estimates of food waste managed by codigestion for a subset of generation sectors (e.g., manufacturing/processing).
Only one report series, authored by EPA, provides nationwide food waste management estimates for codigestion. In the latest report, EPA conducted a nationwide survey of codigestion facilities in the U.S. in 2018, which reflect 2016 data (U.S. EPA, 2019c). Of the 232 surveys distributed to AD facilities, 134 were returned by operational facilities. Another 64 facilities are believed to be operating, for a total of 198, resulting in a survey response rate of 67%. Of the 134 facilities responding to the survey, 126 facilities provided information about the amount of food waste they processed. These facilities reported a total of 10.7 million tons of food waste managed by codigestion annually in 2016 (U.S. EPA, 2019c).
Management Methods By Generator Sector
The industrial sector (food and beverage manufacturers and processors) was estimated to generate 37.8 million tons of excess food and food waste in 2016. About half (49%) of the manufacturing/processing sector’s excess food and food waste was managed by animal feed, 22% by land application, 14% by AD, with smaller proportions managed by other methods. Food manufacturing/processing industries are unique from the other sectors EPA analyzed in the methods they use to manage their food waste and excess food.
The residential sector, which includes single family and multifamily dwellings, was estimated to generate 24.6 million tons of food waste. The majority (67%) of this food waste was landfilled; 15% was combusted, and 15% was sent to sewer/wastewater treatment. Only 3% was composted.
The commercial sector includes food retail/wholesale (supermarkets, supercenters, and food wholesale) and hospitality (restaurants/food services, hotels, and sports venues). Generation, and how the excess food and food waste was managed are as follows:
- Food Retail/Wholesale Sector: Estimated to generate 12.6 million tons of excess food and food waste (8.7 million tons from supermarkets and supercenters, and 3.9 million tons from food wholesale). About one third (31%) of the food retail/wholesale sector’s excess food and food waste was landfilled, about one quarter (24%) was donated, 14% was sent to animal feed, 14% was sent to AD, and smaller proportions were managed by other methods.
- Hospitality Sector: Estimated to generate 18.0 million tons of excess food and food waste. Restaurants/food services accounts for 16.9 million tons, or 94%, of the excess food and food waste generated in the hospitality sector; hotels account for 1.1 million tons and sports venues account for approximately 38,000 tons. Half of the excess food and food waste generated in the hospitality sector was landfilled, 17% was donated, 14% was sent to AD, and smaller proportions were managed by other methods.
The institutional sector includes hospitals, nursing homes, military institutions, office buildings, correctional facilities, colleges and universities, and K-12 schools. The institutional sector was estimated to generate 7.0 million tons of food waste. Office buildings account for 4.0 million tons, or 57%, of the food waste generated in the institutional sector; K-12 schools account for 1.1 million tons and all other sectors account for less than one million tons each. About two thirds (67%) of the food waste generated in the institutional sector was landfilled, 16% was combusted, 14% was sent to AD, and 3% was composted.
Food banks are also a minor generator of food waste, because they receive excess food that is unfit for distribution due to damage, spoiling, and other reasons. Food banks were estimated to generate about 378,000 tons of food waste. About two thirds (67%) of the food waste generated in food banks was landfilled, 16% was combusted, 14% was sent to AD, and 3% was composted.