Which is better for managing source separated organics, anaerobic digestion or aerobic composting? “It’s not an either-or proposition,” suggest the authors.
Tom Kraemer and Scott Gamble
BioCycle November 2014
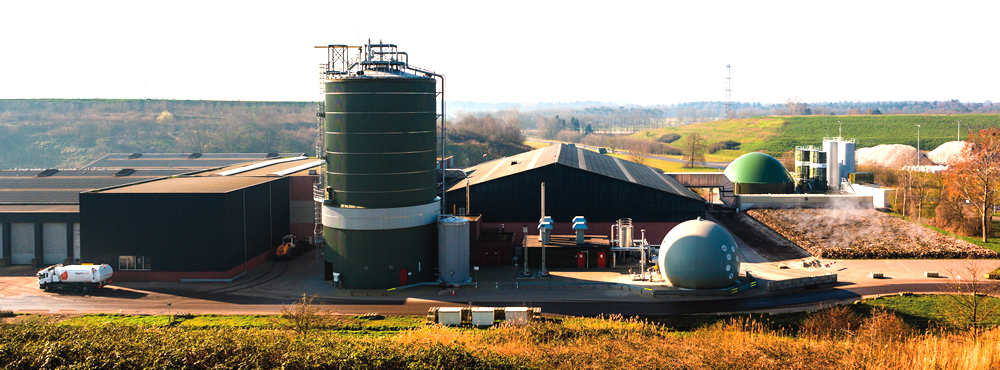
The Hengelo, Netherlands plant employs a continuous plug-flow anaerobic digester integrated into a larger composting operation. The digester, supplied by Organic Waste Systems, processes one-quarter of incoming feedstock on a half-acre footprint at the facility. Photo courtesy of OWS
Is anaerobic digestion better than composting for managing source separated organics? It depends. On project specific factors, anaerobic digestion (AD) is a good bet economically and technically in some situations, and composting (and sometimes other approaches) is right for other circumstances. A better answer, however, is: “It’s not an either-or proposition.” Increasingly, organics processing facilities in Europe and more recently in North America are finding that the two approaches work best when integrated into a single facility.
What are the major project-specific factors to consider when selecting technologies for source separated organics (SSO) processing? In most cases, the following come to fore:
• Which technology is more expensive?
• What do we mean by expensive?
– Input costs (capital and operations and maintenance (O&M))
– Net costs after revenues
– Life cycle costs over the expected life of the facility
• Which one will work best at our site?
• Which one can be permitted more easily and what regulations apply?
• Are there better incentives such as subsidies for one versus the other?
• Which one is the more proven technology?
Feedstocks Drive Everything
The most important question to answer, however, is: “What feedstocks are being processed, how much, and how will they change over the expected life of the facility?” Feedstocks drive everything in organics management. Start by understanding the feedstocks.
Leaves and yard trimmings are generally not as well-suited for AD as for composting. They have low biogas yields, as they are generally resistant to digestion because the typical mix collected in municipal programs has a large proportion of lignocellulosic materials (although grass may digest very well if it is separated). If primarily leaves and yard trimmings are collected, the investment in digestion equipment will generally be too high to justify the returns from biogas and other products, no matter what the incentives.
Food wastes from residential, commercial and institutional sources, fats, oils and grease, and food processing wastes, have much higher biogas yields and digest more rapidly and completely in a digester than leaves and yard trimmings. Whereas yard trimmings typically produce less than 30 cubic meters of biogas per metric ton of as-received raw feedstock (assuming 60% methane by volume at standard conditions of 20°C and 1 atmosphere pressure), food waste typically produces 100 cubic meters of biogas per metric ton received. The highest energy food waste feedstocks can produce five times this much biogas with much less preprocessing and other costs than for leaves and yard trimmings.
Most cities have an abundance of both food waste and leaves and yard trimmings. And if there is a source separation program for organics, in some cases it’s not too difficult to collect these two different kinds of organics separately, because they come from different sources. As a result, composting some of the materials and digesting others in the same integrated plant can work better than managing them in different plants in different places.
Whole Greater Than Sum Of Parts
To understand how AD and composting can be integrated, and assess the benefits and risks, consider the inputs and outputs for each. Organics management, and especially AD, is more complex and has more potential inputs and outputs than many other waste management processes, so using a whole system approach benefits the analysis.
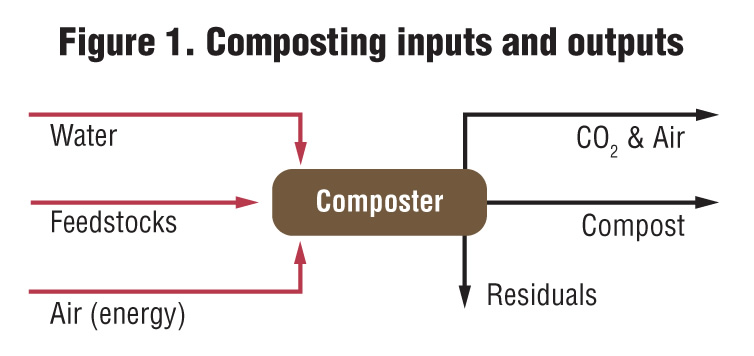
Figure 1. Composting inputs and outputs
Composting Inputs And Outputs
As illustrated in Figure 1, water, feedstocks and air go in. Energy input is primarily to get air into the composting material, which may be by turning or to run fans or blowers for mechanical aeration. Compost is the main output. Residuals are screenings after composting, as well as contaminant removal at the front end.
AD Inputs And Outputs
As illustrated in Figure 2, inputs are feedstocks, energy and may include water, depending on the type of digester and the feedstocks. Outputs are biogas, effluent and digestate. Energy input is required for feedstock preparation, heating the digester tank, and pumping. Considerations regarding energy input include:
• Thermal energy consumption for heating the digester is typically 10 to 20 percent of the energy output from biogas.
• Electricity use is also typically in the range of 10 to 20 percent of available output energy.
• Both thermal and electricity requirements depend on the digester type. It is important when developing conceptual alternatives for integrated AD and composting systems to identify the right type of digester for the mix of feedstocks to be handled. Wet digesters consume more heat and operating power than dry digesters. Thermophilic wet digesters may consume up to 40 percent of heat output whereas “dry” digesters consume much less. Thermal demand in wet digesters is needed to heat the contents and keep them heated, and electricity is necessary to pump the extra liquid around.
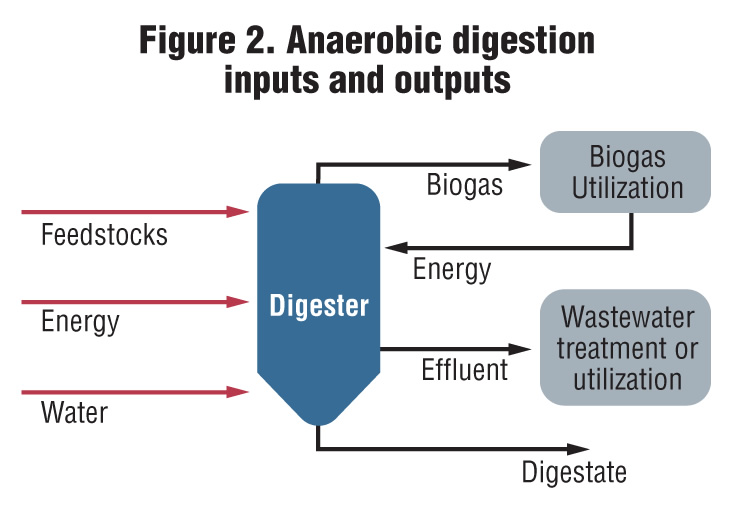
Figure 2. Anaerobic digestion inputs and outputs
In reality, the waste heat from burning biogas to produce electricity is typically far more than needed to heat the digester tank, and electricity production is far more than needed for plant operation. AD waste effluent production ranges from minimal for dry digestion, to 150 gallons or more per ton of feedstock processed for wet digesters. Handling this effluent costs money, and effluent treatment can be a significant factor in evaluating AD technologies.
In terms of the solid digestate, tons coming out are typically 80 percent or so of what went in. Although typically more than two-thirds of the “volatile” organics subject to degradation by anaerobic bacteria are destroyed (converted largely to gas), the majority of feedstocks are composed of water and materials resistant to degradation in an anaerobic environment. The digestate output quantity per ton of feedstock input is a key consideration for evaluating the merits of AD for a given feedstock, and, surprisingly, has often been given insufficient consideration and planning.
Integrated System Inputs And Outputs
What happens when AD and composting are combined? There are some synergies that improve the performance of both. Some of the “waste” products from digestion become inputs to the composting process, and vice versa. With the integrated system, there is less overall waste, and more useful product. Figure 3 illustrates this synergy.
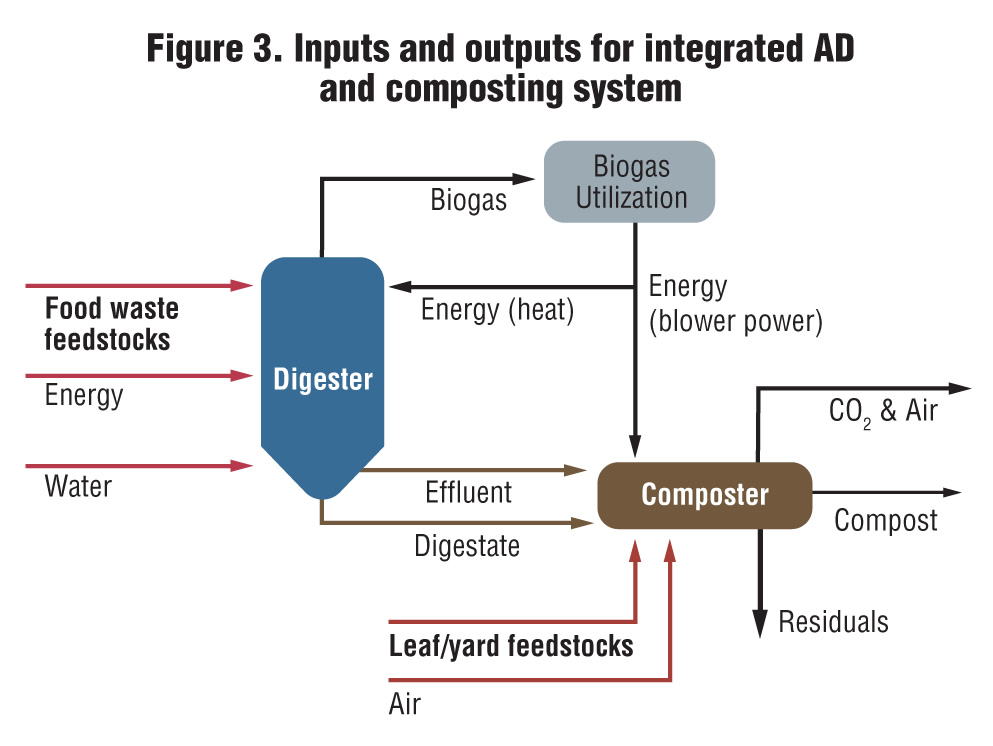
Figure 3. Inputs and outputs for integrated AD
and composting system
Using the leaves/yard trimmings and food waste example as the two primary sources of feedstocks, one type (primarily food wastes) goes into the digester, and the other (primarily leaves and yard trimmings) goes into composting. Digestate from AD now becomes a feedstock for composting. The typical 8 to 12 weeks required for composting raw feedstock may be reduced to as little as 2 to 3 weeks for digestate because the material has been partly decomposed in the digestion process, making it easier for the composting organisms to break it down to stable compost. Experience in Europe has shown that the overall throughput time for material going through anaerobic digestion and digestate composting can be reduced to 5 to 8 weeks. This is a substantial reduction in time (about 40%), which produces a concomitant reduction in both the capital and operating costs for processing the same amount of material.
Other important synergistic effects of combining AD with composting include:
• Effluent treatment can disappear, and if well balanced, the digester effluent water can supply the water required for composting. The quantity of effluent at an integrated facility depends on how much material is being digested versus composted, as well as the type of digester (wet vs dry), weather and composting technology. If only the digestate from a dry digester is being composted, there could be a net water deficit.
• Biogas utilization can supply electric power directly to the composting system, without going through the external power grid.
• Digestate goes into the composter. This method of digestate management benefits from economy of scale of the larger composting system.
Note that the quantities of materials processed in the AD and composting systems don’t need to be equal in quantity to achieve the benefits of integration. Most municipal waste streams have larger leaf and yard trimmings quantities than food waste, so would size the digester considerably smaller than the composting systems, in which leaves and yard trimmings bypass the digester. Bypassing the digester is called “partial stream digestion,” which has proven to provide synergistic benefits in several European plants over the past five years.
Planning An Integrated Composting And Ad System
There are many factors to consider when evaluating the feasibility of an integrated AD and composting system. Breaking the process into the following steps is helpful:
Step #1—Define the feedstocks and projected quantities: Project the quantities for the facility’s life out to the planning horizon, typically 20 years for this kind of project. Use weekly tonnage data on different types of feedstocks composing the organic waste stream. Monthly data is not normally detailed enough, and daily data is often more detailed than needed.
Step #2—Define the scenarios: In defining the scenarios for a facility (composting, AD, combined) include assumptions about preprocessing equipment required, how the products will be handled, type of composting and digestion technology, and similar considerations. Check against basic input/output diagrams for the systems like those presented above. Usually only two or three scenarios, and seldom more than five, will emerge as worthy of consideration at this stage.
Step #3—Develop process flow diagrams: Prepare detailed process flow diagrams for each scenario, once again focusing on the inputs and outputs.
Step #4—Develop site layouts: Develop conceptual site layouts for each scenario — make sure it fits. Draw traffic flow lines for all traffic coming into the site, moving materials and people through, and exiting the site.
Step #5: Compute mass and energy balances: Mass and energy balances must be computed for each scenario (see example in Figure 4).
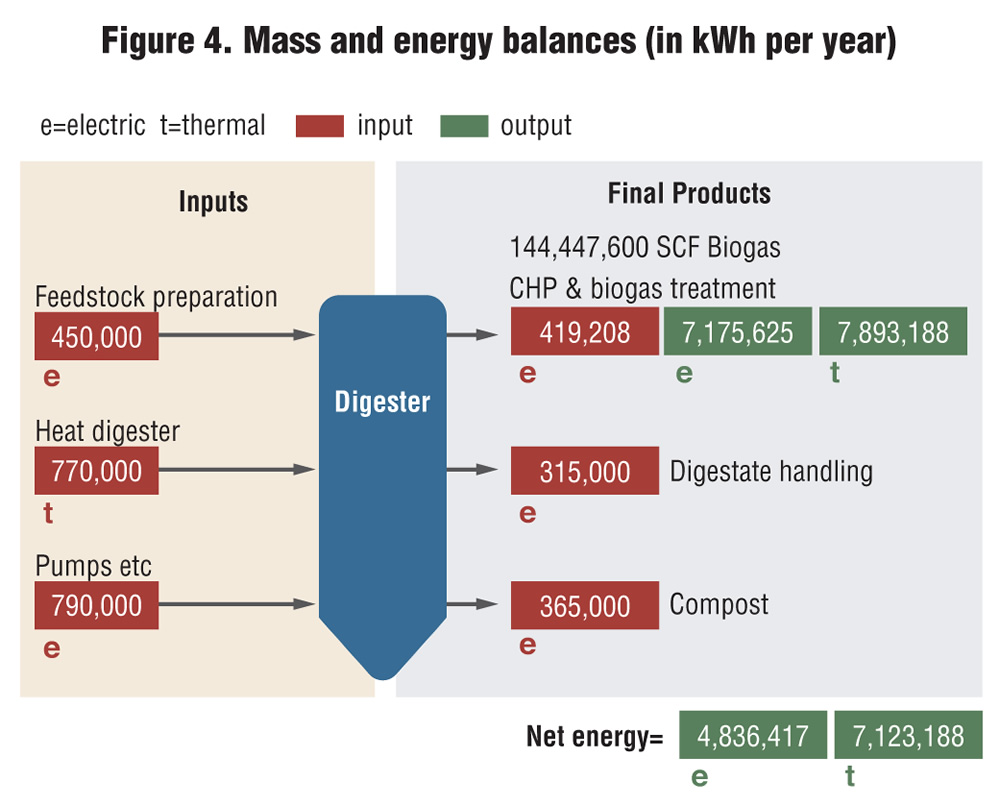
Figure 4. Mass and energy balances (in kWh per year)
Step #6: Conduct economic evaluation: The last step is to conduct an economic evaluation to determine the Net Present Value. Compute and compare the life-cycle net present value for the options over the project life, typically 20 years (but may vary).
The energy balance is more important for AD than for composting. For AD, net energy output is a critical consideration of the technology for SSO management, because energy from biogas is usually the primary benefit (i.e., revenue source) of digestion. How much of that biogas must be used for AD operations has to be determined early on. Analysis is simpler for a composting operation where all energy is in the inputs, but still very important because energy inputs are major determinants of O&M cost.
Composting and AD energy inputs include: Fuel for rolling stock; Heaters, pumps, other mechanical inputs; Aeration for composting and ventilation — both are significant — and aeration for biofilters treating potentially odorous compost exhaust; Feedstock preprocessing; and Treatment costs for biogas, exhaust and wastewater.
Costs And Revenues
In the economic analysis, make sure to include at least the following costs and revenues, annually, over the project life:
• Costs: Capital costs; O&M by year over project life; and Equipment replacement costs.
• Revenues: Tipping fee; Compost sales; Energy sales; Grants, interest-free loans, other incentives; Cost savings, including displacement of existing fuels with biogas, and reduced composting time.
The best way to compare the economics is computing the net present value (NPV) of all costs and revenues over the project life. Future costs and revenues are converted to present value using the appropriate financing interest rate (referred to as the discount rate) and then all present value amounts are summed to the net present value. A positive NPV means a project makes money and a negative NPV means there is a net cost to providing the services.
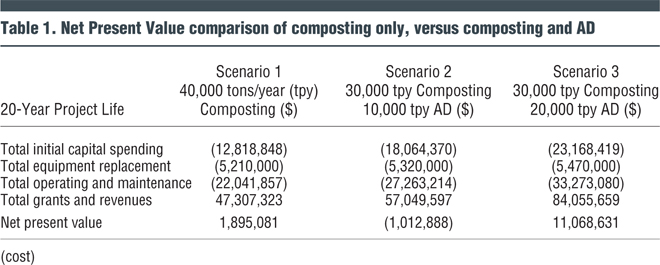
The example provided was done for an actual project plan for a small California city. One compost-only scenario was compared with two AD scenarios (Table 1). The first two scenarios both assume 40,000 tons per year of feedstock processed, with all going into compost in Scenario 1. In Scenario 2, 10,000 of the 40,000 total tons is digested because it is a mostly food waste stream that can be collected separately from commercial and institutional establishments. Even with nearly $10 million additional revenue in Scenario 2, the overall project NPV is negative because of additional costs, whereas the Scenario 1 overall NPV is positive.
So AD is not a good candidate here, is it? Well, “it depends” is once again the right answer. Scenario 3 (Table 1) shows that, because of economies of scale and the availability of incentives (in this case, state grants above a certain level of renewable energy production), if the city could gather an additional 10,000 tons/year of food waste, AD would provide a better economic result, when integrated into a combined composting/AD system where leaves and yard trimmings are composted together with digestate from a food waste digester. Table 1 provides a NPV comparison of the three scenarios.
For some public sector project owners, evaluations can go a step further and include social and economic factors in a multi-objective decision analysis (MODA) — a quantitative, formalized process for including multiple financial, social and environmental objectives in an analysis of different project alternatives. The different objectives are identified and given quantified weights, by consensus of the stakeholders. Each alternative is then scored on the basis of one or more performance measures relative to each of the objectives. The alternatives are then ranked based on the final scores. Whether a strictly economic or more comprehensive MODA analysis is used, the final ranking depends on project specifics.
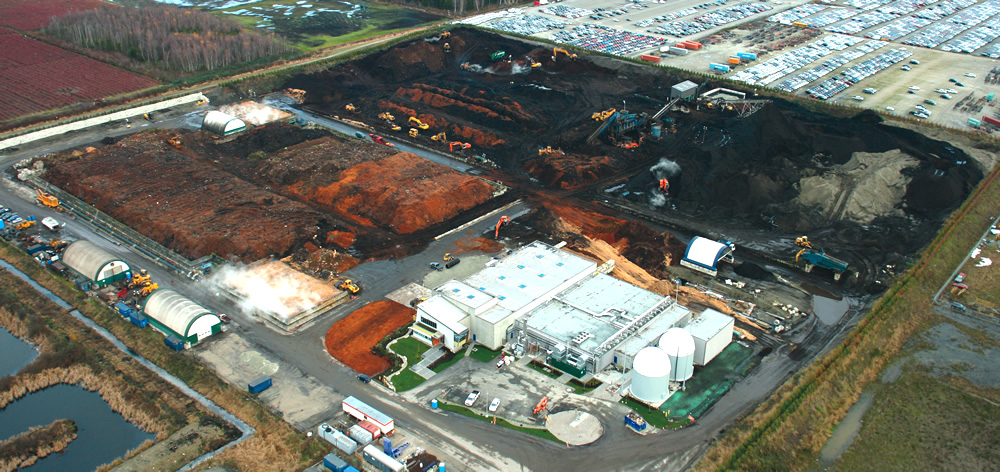
Harvest Power’s Energy Garden and Composting Facility in Richmond, British Columbia began operating as an integrated AD and composting facility in 2012. Previously, the facility was only composting. The digester (lower right of photo) processes over 20,000 tons/year of food waste. Photo courtesy of Harvest Power
Case Studies
In North America, Harvest Power’s Energy Garden and Composting Facility in Richmond, British Columbia (Canada) has been operating as an integrated AD and composting facility since start-up of the digester in 2012. The facility serves the Metro Vancouver Region of British Columbia, with a landfill ban on organics coming up in 2015.The composting facility, which was in operation long before the digester was built, handles approximately 220,500 tons/year of combined food and yard waste, much of it provided by the City of Vancouver and other Metro Vancouver local governments. The digester handles an additional 22,000 tons/year of commercial food waste. This plant uses GICON two-stage high solids AD (HSAD) technology and composts digestate in outdoor, negatively aerated static piles.
JC Biomethane in Eugene, Oregon has been in operation since late 2013, and processes commercial food waste and food processing waste from the Portland, Metro area (see “Digester Fueled By Postconsumer Organics,” March/April 2014). It handles approximately 12,000 tons/year of commercial food waste, 6,000 tons/year of food processing waste, and small amounts of manure. JC Biomethane uses wet digestion (Entec system). The digestate is composted in a windrow system appropriate for the facility’s agricultural location outside of Eugene.
And Zero Waste Energy Development’s HSAD facility in San Jose, California is designed to handle 90,000 tons/year (Phase 1) of organics from the “wet/dry” institutional, industrial and commercial (ICI) organic waste collection system overseen by the City of San Jose (see “High Solids AD + Composting In San Jose,” March/April 2014). The project uses a Kompoferm HSAD system designed by the German firm Eggersmann and built in the U.S., and composts the digestate in tunnel composters within the facility, totally enclosed to ensure control of odors in the urban San Francisco Bay Area environs.
In Europe, several plants are employing partial stream digestion. Examples include the Hengelo, Netherlands plant, where Organic Waste Systems (OWS) has designed and built a system employing a continuous plug-flow anaerobic digester integrated into a larger composting operation. The system is designed for 48,500 tons/year of biowaste (combined yard/food waste), and about 12,000 tons/year of preconsumer food waste. The AD system adds significant capacity with a much smaller footprint for the amount of capacity it provides than composting. The total footprint of the composting process systems is approximately 4 acres (inside a totally enclosed building), whereas the footprint of the AD process is only one-half acre, one eighth the size but processing one-quarter of the plant tonnage input.
A similar OWS plant in Tenneville, Belgium is designed for much different proportions of feedstocks: 47,400 tons/year of food waste, 15,400 tons/year of yard trimmings, and about 1,500 tons/year of liquid organic waste. In this plant, up to 70 percent of incoming organics goes into anaerobic digestion.
Tom Kraemer and Scott Gamble are with CH2M HILL in the company’s Bellevue, Washington and Edmonton, Alberta offices respectively.