BioCycle March 2008, Vol. 49, No. 3, p. 26
CIWMB-funded study on composting emissions from food and green wastes provides valuable data.
Bob Horowitz
A NEW study funded by the California Integrated Waste Board (CIWMB) indicates that well-managed composting of green waste and food waste releases significantly less air pollution than previously thought. The study also demonstrates that a relatively inexpensive management technique – covering active compost piles with a layer of finished compost – may lower air emissions even further, by as much as 75 percent compared to uncovered piles.
 These findings come at a critical time for California. Air quality districts in several regions of the state are considering regulations that require green waste composters to reduce emissions of Volatile Organic Compounds (VOCs), which react with other chemicals in the air to produce ground level ozone, a “criteria” pollutant subject to the federal Clean Air Act. These new rules could significantly impact composters.
The San Joaquin Valley Unified Air Pollution Control District (SJVUAPCD, or the Air District) covers eight agricultural counties in the southern half of California’s Central Valley. The Air District has already begun its rulemaking process. Composters located in the San Joaquin Valley produce about half of all compost made in California. The largest operations in this region import curbside green waste and food waste from the Los Angeles and San Francisco/Oakland urban areas, but sell their finished product to nearby farmers. Therefore, actions taken in the San Joaquin Valley have a potentially huge impact on California’s compost industry, on the solid waste diversion performance of some of California largest jurisdictions, and on the continued growth of sustainable agriculture in California’s agricultural heartland.
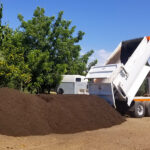
The CIWMB conducted its new study within the San Joaquin Valley, at the City of Modesto’s composting facility, located about 100 miles east of San Francisco. This facility composts about 65,000 tons of materials per year, mostly from the city’s own curbside program, but also from landscapers and neighboring cities. The materials are tipped onto a concrete pad and ground before being shaped into windrows, which are then turned with a windrow turner.
The CIWMB’s goals were two-fold: first, to establish realistic VOC emissions from green waste and food waste composting for a complete composting cycle of around 60 days; and second, to test the efficacy of two potential emission control practices over the most active composting period, the first two weeks of the process. “We wanted to go beyond the previous work, which looked at a point in time – a few days, or at best a couple of weeks,” says Brenda Smyth, project lead for the CIWMB. “We wanted to create a detailed emissions profile of an actual compost windrow over the entire lifecycle of the process, as well as evaluate the two potentially most cost-effective best management practices.”
MODESTO STUDY
To initiate the study, workers created four new windrows, each about 100 feet long. The windrows are described as follows: 1) Pure green waste; 2) Green waste mixed with approximately 15 percent food waste from a local cannery; 3) Green waste capped with approximately 20 tons of finished, screened compost, applied with a loader (pseudo-biofilter windrow); and 4) Green waste with two commercial additives (additive windrow). The first additive, a micronutrient to feed beneficial microbes, was mixed into the windrow with a turner; the second additive, designed to form a crust on the windrow that limits the escape of odors and emissions, was applied topically.
For the pseudo-biofilter windrow, unscreened finished compost was used to replenish the cap after windrow turnings. For the additive windrow, the topical additive was reapplied after turnings. Aside from those differences, the windrows in the study were constructed the same as other rows in this facility, and managed the same. Modesto’s standard operating procedures start with materials from the city’s curbside green waste program. Those are mixed with higher-carbon feedstock from the city’s tree pruning program, and formed into windrows, normally 18 feet wide and 7 feet tall. Using a Wildcat, workers turn the windrows once a week for 12 weeks, as they put the materials through pathogen reduction. After that, the windrows cure for up to six months, with turning scheduled about once a month. Water is added using a reel system and custom sprinkler heads.
The CIWMB’s contractor pulled a total of 100 emissions samples from the four piles, as well as 9 quality control samples. Emissions sampling started on the first day after windrows were constructed, and ended on day 57. Each sample was collected using a USEPA surface emission isolation flux chamber and stored separately in a stainless steel canister (and a vial for the condensed liquid fraction). The samples were shipped overnight to a laboratory in southern California, where they were analyzed according to South Coast Air Quality Management District Method 25.3.
Previous CIWMB studies indicated most emissions vent near windrow ridgetops. This study further explored that phenomenon, by separately analyzing emissions from the ridgetop, sides and bottom sections of the four windrows. The CIWMB’s contractor identified high- and low-emitting areas on the ridgetops using a portable gas analyzer, and then sampled from both zones. The sample results were analyzed to formulate an accurate ridgetop estimate. Overall, emissions fluxes (amount of emissions per square foot of surface area), as well as emissions factors (amount of emissions per ton of feedstock), were calculated for each windrow.
Composting emissions likely depend upon a range of factors, such as materials mix, weather conditions, aeration, moisture content and even the size and shape of the pile. Therefore, no one emissions estimate will fit all circumstances. However, this study, titled “Emissions Testing of Volatile Organic Compounds at the Modesto Compost Facility in the San Joaquin Valley,” provides the most extensive data set to date.
THE FINDINGS
Primary findings of the study are as follows:
o Lifecycle VOC emissions from green waste composting in windrows were measured at less than one pound of VOCs per ton of compost feedstock (Table 1).
o Seventy to eighty percent of compost pile VOC emissions vent through the ridgetop. However, ridgetops include zones that visibly vent emissions, as well as other zones where emissions are not as obvious. A hand-held emissions analyzer was used to clarify venting vs. non-venting zones on the ridgetop.
o Seventy to eighty percent of lifecycle VOC emissions occur during the first two weeks of composting.
o Addition of food waste to the green waste matrix roughly doubled VOC emissions (Table 2).
o VOC emissions from the pseudo-biofilter windrow were 75 percent less than the comparable green waste windrow over the first two weeks (Table 2).
o VOC emissions from the additive windrow were 14 percent less than the comparable green waste windrow over the first two weeks.
The study suggests a pseudo-biofilter applied to active compost piles may be a particularly cost-effective method to dramatically reduce composting VOC emissions. Industry experts estimate that converting a conventional windrow composting facility to aerated static piles might cost as much as $100 per ton of capacity, or $6.5 million for a facility the size of Modesto’s. This would include the costs of concrete and piping, as well as all of the pumps and the biofilter, but would not include financing or ongoing operational costs such as electricity to run the pumps. By contrast, the pseudo-biofilter in this study costs 60 cents per ton of production.
The additives cost around $1.50/ton. While they did achieve a 42 percent reduction in VOC emissions in the first week, their efficacy waned in the second, resulting in an overall two-week emissions reduction of 14 percent. Although the topical application was reapplied after turning, the inoculant was not. It is plausible that subsequent applications of the inoculant would have maintained additive performance over the second week.
COMPARISON TO EARLIER STUDIES
To put the findings of the most recent study conducted by CIWMB into context, it is helpful to provide a brief history of earlier studies. Emissions testing at composting facilities started in southern California in the mid 1990s. Air quality regulators were initially concerned about biosolids “cocomposting,” which was thought to contribute ammonia as well as VOCs to the air. When air quality regulators first tested emissions at one green waste-only facility in 2001, they calculated VOC emissions rates at 3.84 lbs/ton, more than double the measurements at “cocomposting” facilities. The emissions measured during the Modesto study are less than 25 percent of this rate.
The two earliest emissions studies were designed to measure emissions from one facility, not from an industry. In the first of those, testers used one flux chamber to pull eight emissions samples from one windrow. These eight windrow samples were combined into one “integrated” sample and analyzed. The remainder of the samples came from large tipping piles and even larger piles of processed materials waiting to be put in windrows. In the second study, the large tipping and static piles were sampled with an “open-path laser;” windrow data from the first study was reused. By contrast, the CIWMB’s new Modesto study relies upon 100 flux chamber samples, all taken from windrows. Each sample was collected separately with a “clean” flux chamber, placed into its own canister and vial, and analyzed individually.
Furthermore, the two early studies profiled what appears to be a highly atypical facility. The percentage of materials held in tipping and static piles reported at that facility – more than 80 percent – does not correlate with composting facilities observed in the San Joaquin Valley, which are characterized by small tipping and static piles and acres of windrows. The early studies clearly indicated windrow emissions are much lower than emissions from large tipping and static piles. The Modesto study confirms that observation. It seems reasonable to apply an emissions factor heavily weighted toward windrows when assessing the impacts of facilities like the ones found in the San Joaquin Valley, where more than 90 percent of the feedstocks on any given day are in windrows.
Clearly, more research was needed, so in 2004 the CIWMB contracted with San Diego State University to implement a comprehensive lifecycle study of green waste composting emissions. CIWMB staff worked with Dr. Fatih Büyüksömnez of San Diego State and local air district staff to develop the protocol, which included emissions testing before and after a windrow turning event on Day Seven. Flux chamber expert Dr. Chuck Schmidt was brought in to perform the actual sampling, which occurred in October through December of 2006. The results of this work were published by the CIWMB in December 2007, and are available on the CIWMB web site (http://www.ciwmb.ca.gov/publications/organics/44207009.pdf).
GREEN MISSIONS COLLIDE
Since the passage of the Integrated Waste Management Act in 1990, which mandated all cities and counties divert half of their solid waste away from landfills, the California composting industry has grown. Years of education about the benefits of compost are finally paying dividends, as farmers and public works agencies use more compost than ever.
Despite these efforts, the CIWMB estimates that at least 10 million tons of compostable organics are still being sent to California landfills each year, approximately 25 percent of all materials currently disposed. Woody debris accounts for another 13 million tons of disposed materials. CIWMB strategic directives call for halving the amount of organics sent to the landfill by 2020. Some 50 to 100 new facilities, each capable of processing around 100,000 tons per year – combined with a commensurate expansion in existing facilities, and an increase in source reduction via grasscycling and sustainable landscaping – will be needed to meet CIWMB’s goal.
In the midst of these efforts, air quality districts in California are faced with cleaning up some of the dirtiest air in the nation. These local districts have no control over cars, diesel trucks or other mobile sources. However, individual regions face penalties – including the loss of federal highway funds – if they do not attain federal air quality standards by 2024.
The San Joaquin Valley air district, which is much less industrialized than its neighbor to the south in Los Angeles, has perhaps the most daunting task of all: to pull some 111 tons/day of VOCs and 382 tons/day of NOx out of the air by 2023. They are looking to green waste composters for 9 tons/day of VOC emissions reductions starting in 2012, and ramping that up to 11 tons/day by 2020. The SJVUAPCD is expected to introduce a draft regulation in April 2008, and adopt a regulation by early 2009. Although the exact language of the regulation is not yet known, the CIWMB is hopeful that the regulation will focus on best management practices rather than controls and monitoring.
California’s landmark legislation to reduce greenhouse gas emissions 25 percent by 2020 further complicates the picture. The CIWMB, and other stakeholders, see green waste composting as an important method to avoid landfill methane emissions and sequester additional carbon in the soil. But these potentially significant and calculable greenhouse gas reduction benefits are not yet quantified, and will not be quantified within the time frame set out by the local air district for rulemaking.
Additionally, local air districts like the SJVUAPCD strictly focus on criteria pollutants (or precursors like VOCs) and their impact on local air quality. They might not be swayed by composting’s potential long-term climate benefits, which accrue across air district, state and national boundaries.
Given the low cost of landfilling in the mostly rural San Joaquin Valley – around $20/ton in some areas – green waste composters (unlike biosolids cocomposters) have very little leverage to raise rates in order to cover new costs. For instance, green waste can be disposed at any landfill, whereas biosolids may only be disposed at landfills specifically permitted to accept that material; generally those landfills have the most advanced liners. Furthermore, green waste may also be taken by any landfill at a reduced tipping fee and used for alternative daily cover (ADC) or other beneficial uses. Biosolids can be used as ADC in California, but again, only at selected landfills, and very few of those are in the San Joaquin Valley. In 2006, nearly 10 times more green waste was used as ADC in California than was biosolids. Currently, California counts ADC as solid waste diversion, rather than disposal. However, recently introduced Assembly Bill 2640 aims to remove that advantage by January, 2015.
Due to these economic constraints, green waste composters likely will need public assistance and/or carbon credits in order to be able to fund expensive emissions capture and destruction systems, like aerated static piles and biofilters. Public assistance is not currently available, and even with carbon credits, green waste composting economics may not be strong enough for existing composters to justify taking a multi-million dollar risk just to stay in business.
For all of these reasons, the SJVUAPCD will be closely watched by the CIWMB, farmers and the composting industry. Other air quality regulators around the state – who face similar pressure from federal regulators, clean air advocates and their own citizens – will no doubt be watching as well.
By funding the work at Modesto, as well as previous work at composting facilities in Southern California, the CIWMB has at least contributed to a body of scientific evidence that will help guide this process.
Bob Horowitz is a Senior Integrated Waste Management Specialist with the California Integrated Waste Management Board. He can be reached at rhorowitz@ciwmb.ca.gov. He will present findings of the Modesto study on Tuesday, April 15, 2008 at the BioCycle West Coast Conference. Also presenting in that session is David Warner of the San Joaquin Valley Air Pollution Control District, who will provide an update regarding air quality issues related to composting, including existing and upcoming organic waste processing regulations, VOC emissions, greenhouse gas considerations, permitting requirements, and Best Available Control Technology.
Lifecycle Assessment Of Organic Diversion Alternatives
AN estimated three million metric tons of CO2 Equivalent were reduced in 2006 when California achieved the 50 percent statewide recycling goal, as established by Assembly Bill (AB) 939. However, California still disposes an estimated 42 million tons of waste in landfills each year. This waste stream consists of approximately 30 percent compostable organic materials, 22 percent construction and demolition debris and 21 percent paper. Approximately 73 percent of California’s waste stream thus consists of carbon-based organics that could be diverted from the landfill to help achieve the greenhouse gas (GHG) reduction goals established by the Global Warming Solutions Act of 2006, AB 32.
The California Integrated Waste Management Board (CIWMB) is working with RTI International, R.W. Beck, Matthew Cotton and Dr. Sally Brown to perform a Life Cycle Assessment (LCA) of organics diversion alternatives in support of AB 32. The objectives of this project are to quantify GHG emission reductions from implementation of organic diversion alternatives and to perform an economic analysis to determine the associated costs and cost savings of the selected organic diversion alternatives on a regional and statewide basis.
Project Scope
The project is broken up into 15 tasks with 3 main project parts: 1) Life Cycle Assessment, 2) Economic analysis, and 3) GHG tool development and final report. The LCA component will identify GHG emissions and reductions from selected organic diversion alternatives. This portion of the project will include an evaluation of existing municipal solid waste LCA tools, development of LCA model, data collection, conducting a Life Cycle Impact Assessment and interpretation of LCA results. The LCA will be used to evaluate GHG emissions and GHG emission reductions for individual or combinations of organic material diversion alternatives in at least three regions in California (Southern, Central Valley and Bay Area).
The economic analysis will quantify costs and cost savings as well as the diversion potential of the selected organic diversion alternatives. This will include the projected capital costs, operating costs and revenues for each selected diversion alternative in 2005 U.S. dollars on a per ton and per MMTCO2e basis. Costs and benefits will be quantified for each diversion alternative at each stage of the waste management system, including generator, hauler, processor and end-user. The cost-effectiveness and economic impact (direct, indirect and induced) of each organic diversion alternative will be quantified on a regional and statewide basis. The economic analysis will strive to quantify which combinations of organic diversion alternatives are appropriate in the selected regions of California to achieve GHG reductions in the most cost-effective manner.
The GHG tool development and final report will combine all the project elements into a California specific, dynamic tool and a project report that can be used by CIWMB staff, local jurisdictions and industry to prioritize organic diversion alternatives for maximum GHG reductions in a cost effective manner on a regional and statewide basis. A detailed user’s manual will enable the effective utilization of the GHG tool.
The LCA team is currently working on the initial phase and anticipates completion of the project in spring of 2009. For more information on the LCA of Organic Diversion Alternatives, visit the CIWMB Climate Change website: http://www.ciwmb. ca.gov/Climate or send an e-mail to OrganicsLCA@ciwmb.ca.gov. — Clark Williams, California Integrated Waste Management Board
March 19, 2008 | General