An international standard creates a set of requirements for accounting and reporting on food loss and waste, providing a common language for measurement.
Brian Lipinski and Kai Robertson
BioCycle June 2017
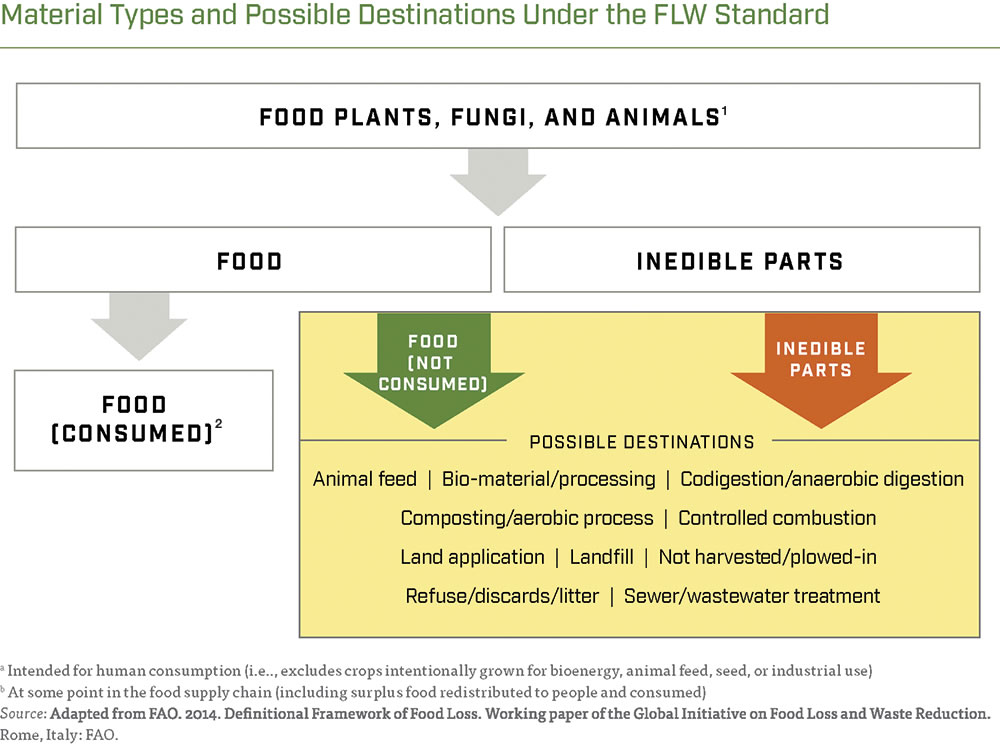
Material types and possible destinations under the FLW standard
Many countries, cities, companies, and other entities currently lack sufficient insight into how much, why, and where food and/or associated inedible parts are removed from the food supply chain (often referred to as “food loss and waste” or FLW). This makes it difficult to develop strategies and prioritize actions to prevent FLW, and to identify the most productive use of the FLW that does arise. In short, it is challenging to manage what is not measured. Moreover, what’s considered “food loss and waste” varies widely and, without a consistent set of definitions or an accounting and reporting framework, it is difficult to compare data within or among entities over time and draw useful conclusions.
To address this measurement conundrum, the Food Loss and Waste Accounting and Reporting Standard (FLW Standard) was published in June 2016 by the World Resources Institute, which served as Secretariat of a global, multistakeholder partnership. This globally applicable standard helps companies, countries, cities and others quantify and report on the weight of FLW. The standard is voluntary and designed for users of all types and sizes, across all economic sectors. Over 200 reviewers from around the world provided input to the development of the FLW Standard to ensure its global applicability.
The FLW Standard provides a set of requirements for accounting and reporting on an FLW inventory in a consistent and transparent way. A related key benefit is that it provides a common language for describing what is included in an FLW inventory, known as the scope of the inventory. The FLW Standard includes guidance, resources, and examples to assist in using the standard, along with a separate short Executive Summary of the standard’s most important features. Quantifying FLW (and developing an inventory) informs and focuses strategies for minimizing FLW, which in turn can provide economic benefits, enhance food security, improve natural resource use efficiency, and reduce environmental impacts.
Scope Of Inventory
The four primary components of the FLW Standard scope are:
• Timeframe: Period of time for which the inventory results are being reported
• Material type: Materials included in the inventory (food only, inedible parts only, or both)
• Destination: Where FLW goes when removed from the food supply chain (10 possible destinations are included)
• Boundary: Food category, life cycle stage, geography, and organization
While the FLW Standard provides a clear and firm set of definitions, it allows a user to be flexible in considering what to quantify and how. For example, a user concerned with food security as a primary reason for reducing FLW will likely consider only food as a material type, and not inedible parts (such as bones, rinds or pits). That same user may also consider all 10 destinations for food removed from the food supply chain to be FLW, since that food is not reaching people.
Another user may be more interested in reducing FLW as a business opportunity to save money and increase operational efficiency. In this case, the user is likely to consider both food and inedible parts as material types, since both represent a loss of resources. They may not consider destinations where value is recovered (such as animal feed or anaerobic digestion) to be FLW, since there is still a benefit being extracted from the material after it leaves the food supply chain.
Once the scope is established, a user begins quantifying FLW, based on its goals, scope, and the resources available to the user. Data is gathered and analyzed, and placed into the format provided in the FLW Standard. (The summary of requirements is on the last page of the Executive Summary; a sample reporting template is available at www.flwprotocol.org.) The FLW Standard allows for users to select the quantification method(s) that meets its needs. It does not prescribe a single quantification method but to ensure transparency, does require the quantification method used is reported along with the level of uncertainty.
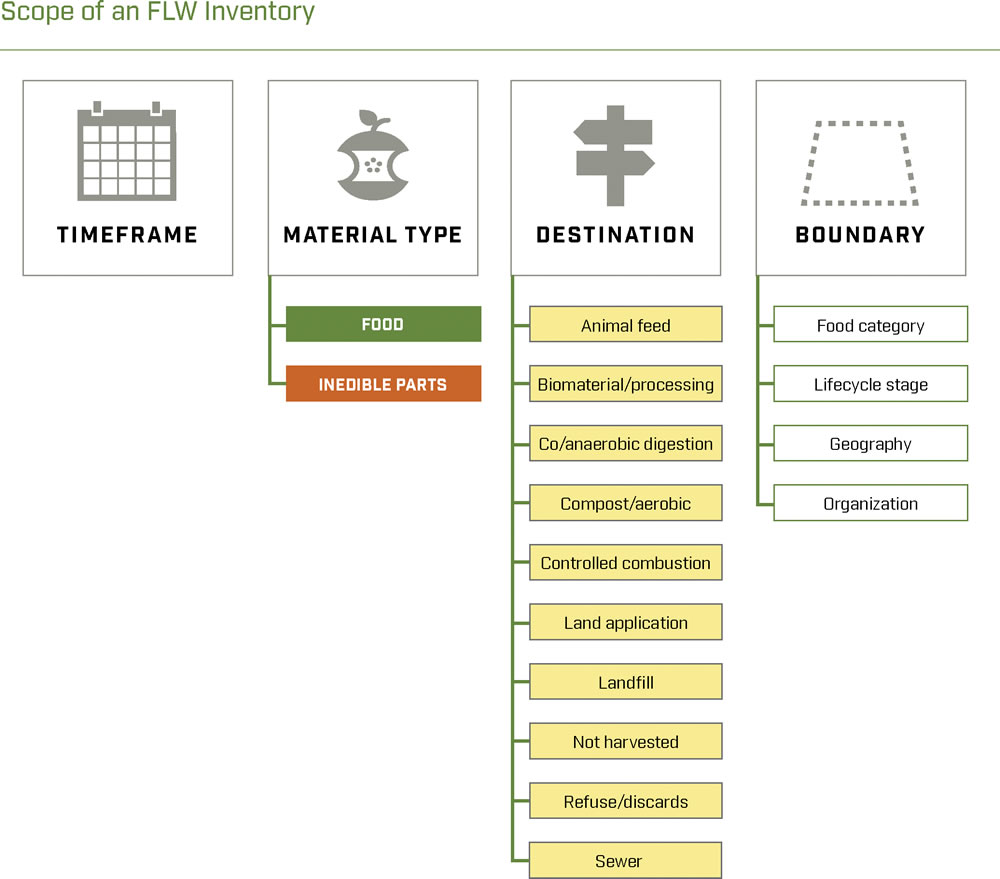
Scope of an FLW inventory
Why Quantify FLW?
Quantifying FLW is an important foundation for reduction initiatives that can deliver a diverse array of benefits — from reducing costs associated with over-purchase and disposal, to avoiding greenhouse gas emissions, or supporting programs to eliminate hunger. Entities that prepare inventories in conformance with the FLW Standard will be better informed about how much FLW is generated and where it ends up, and therefore better equipped to take action.
Additionally, taking steps to reduce FLW makes economic sense for businesses and governments. In the case of a 2007 campaign to reduce household food waste in the United Kingdom, every £1 ($1.30) invested in catalyzing household food waste reduction resulted in savings of £250 ($322.84). A similar city-level campaign in six neighborhoods in London resulted in savings of 8 to 1. And a 2017 analysis of 1,200 business sites in 17 countries conducted by the Champions 12.3 coalition found that for every dollar invested in food loss and waste reduction, the median return on investment was $14.
Case Studies
The FLW Standard is being used by businesses and governments all over the planet. The following are excerpts from two case studies available at the FLW Protocol website, where additional case studies will be published throughout the year.
Nestlé Dairy Factories, Pakistan
“In 2014, to further understand and reduce the waste occurring in our value chain, we initiated a milk loss and waste mapping exercise in Pakistan, applying the draft FLW Standard. Reporting our data in conformance with the FLW Standard has been a valuable process that allowed us to identify quantities and destinations for each type of milk loss and waste along the value chain. … The total milk loss and waste across all stages of the value chain was estimated to be only 1.4 percent of milk produced. About 40 percent of the losses and waste were generated at the farm level stage. This low level of loss and waste confirmed for us that the steps we have been taking over many years to reduce loss and waste are working.
“Actions we have taken include:
• Providing adequate cooling, storage, and transportation systems that are used by farmers
• Training farmers and sharing best practices among them on approaches that not only help increase milk production, but also reduce post-harvest losses (e.g., rejection by chilling centers)
• Implementing lean management and problem solving methodologies to identify, reduce, and report losses and waste from farm to factory.
“Losses could be reduced even further through improved management of products at the retail stage.”
Delhaize America’s Stores and Distribution
“A long-standing priority of our business has been to effectively manage the food that we offer our customers. Many years ago, we began partnering with local communities to redistribute safe, unsold food to reduce hunger. These actions were driven by real business needs, and real community needs— addressing them has made our business stronger. … More recently, we expanded our view up and down the value chain, finding new innovations with suppliers that reduce food waste and create new business opportunities from food that would otherwise have been wasted. The FLW Standard is very helpful because it gives us a clear unambiguous way for talking about food waste.
“As a result of continuous measurement since 2008 and implementing a range of food waste reduction procedures, we have seen a significant reduction in food waste. We continue to have more confidence in the metrics we are using to evaluate our progress and recently started tracking our progress on a quarterly basis using three metrics: metric tons of food waste per sales, percentage of food waste recycled (i.e., diverted from landfill), and metric tons of food donated.”
Brian Lipinski is an Associate with World Resources Institute (WRI). Kai Robertson is Lead Advisor, Food Loss & Waste Protocol, with WRI (wri.org).