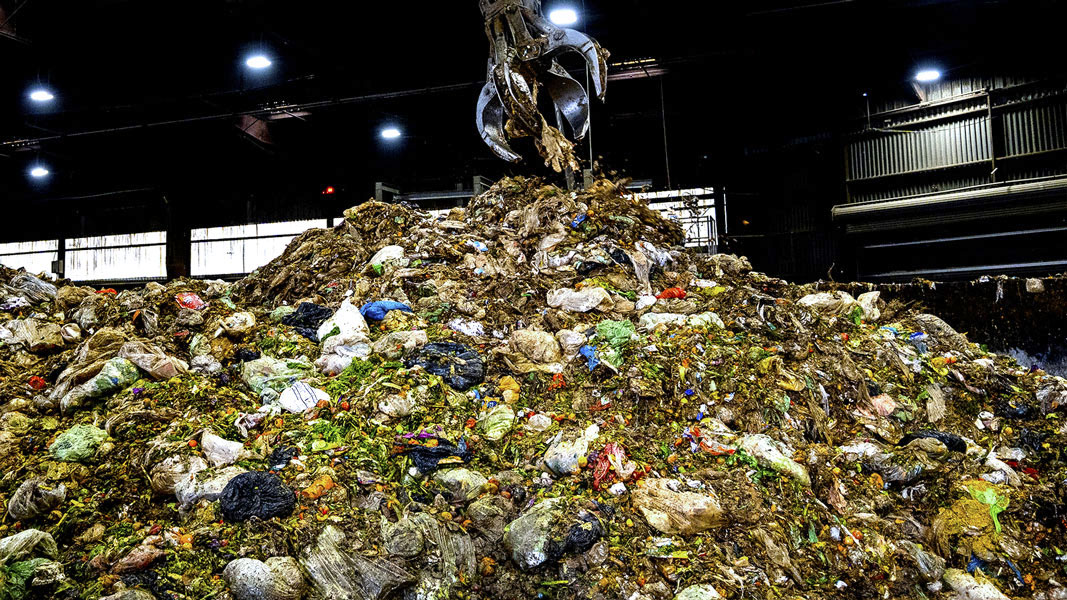
Top: Tip floor at WM CORe facility at Varick transfer station in Brooklyn with collected residential and commercial NYC organics.
Romy Carpenter and Andrew Carpenter
The New York City Department of Environmental Protection (NYC DEP) worked with Northern Tilth, LLC to complete an assessment of greenhouse gas emissions (GHG) associated with five separate management options for source separated organics (SSO), a combination of residential food scraps and organics collected from commercial and institutional sources. This article assesses SSO management options that are currently available to New York City (NYC) and replaces default coefficients with actual values taken from city operations to complete the modeling.
Emissions are calculated over a 100-year time frame and represented as a single value of total carbon dioxide equivalent (CO2 eq). The management options include two in which SSO is managed separately from NYC biosolids and three options where SSO is combined with biosolids for codigestion in existing anaerobic digesters. Northern Tilth used the Biosolids Emissions Assessment Model (BEAM) as the basis for the GHG calculations in this article, but has tailored the model to specifically address SSO collected in and managed by NYC.
The five different SSO management options modeled are as follows.
- SSO taken directly to disposal (primarily landfill with some going to combustion).
- SSO delivered directly to a windrow composting facility within 30 miles of NYC, followed by use of the compost as a soil amendment.
- SSO processed by a physical contaminant removal system, made into a slurry, codigested in one of the anaerobic digestion systems at a NYC’s Water Resource Recovery Facility (WRRF), dewatered and then disposed in a landfill.
- Same process as #3 except solids are dewatered and land applied as biosolids.
- Same process as #3 except solids are dewatered, composted at a biosolids composting facility, then used as a soil amendment.
Model Boundaries and Inputs
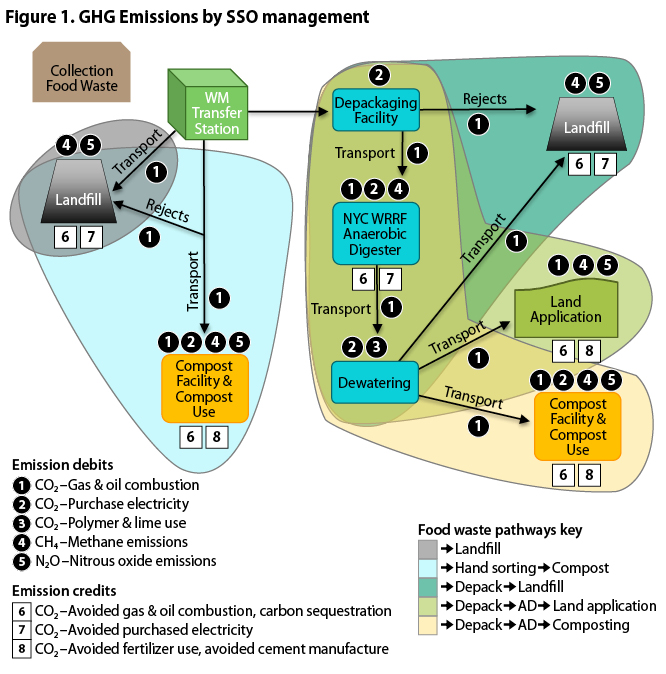
To provide a direct comparison of GHG costs and benefits, Northern Tilth’s modeling started at the same management location for each SSO option and ended with the final use or disposal of the material. The starting point was a transfer station at which unprocessed SSO is tipped after collections. The total amount collected in 2019, the last year before the pandemic disruption, was 50,000 wet tons; this was the amount of SSO modeled for this assessment. Figure 1 provides a flow chart showing the boundaries of the model for each option and the potential GHG costs and benefits captured in each option.
 For landfilling, the capping and gas capture strategies were set to mimic the “typical” U.S. landfill scenario as modeled by the U.S. Environmental Protection Agency in its WARM model. This landfill scenario assumes zero methane capture in the first year after waste is landfilled, 50% capture in years two to four, 75% capture in years five to 14, and 90% capture after capping in year 15; 50% of the captured methane is used to generate electricity.
For Option 2, composting, it was assumed that the SSO was trucked from the transfer station to a windrow composting operation within 30 miles of the transfer station, and that the SSO was mixed with leaf and yard waste to make the final compost blend. It was assumed that the windrow composting operation was not using a biofilter cap during composting and that the finished compost was used within 30 miles of the compost facility.
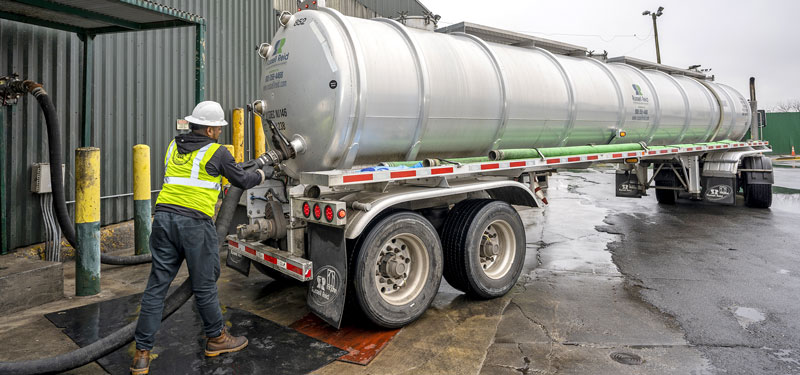
SSO processed at WM’s CORe® facility into a bioslurry is transported in tanker trucks to the Newtown Creek Water Resource Recovery Facility (WRRF). Photos courtesy of NYC Department of Environmental Protection
For Options 3, 4, and 5, the SSO was modeled to go through depackaging in Waste Management’s (WM’s) CORe® processing system to create an engineered bioslurry (EBS® or slurry) product, transported and fed to the anaerobic digesters at NYC DEP’s Newtown Creek WRRF.
Assumptions for options using anaerobic digestion are based on data and feedback from NYC DEP. Northern Tilth used a volatile solids (VS) content of 86.5% (dry wt.) for the SSO, and 75% VS destruction during digestion. As calculated from the initial VS content and the VS destruction, the anaerobic digestion process reduced the mass of the SSO by 65% on a dry weight basis. DEP conservatively selected these variables because, at the time of this study, its codigestion system was loaded at lower percentages due to limited availability of SSO, making the data more qualitative than quantitative. Other utilities have seen higher biogas conversion rates, such as Greater Lawrence Sanitary District (Lawrence, MA) which estimated the volatile solids reduction (VSR) of EBS® to be 86.5%, which is comparative to previous evaluations from the Los Angeles County Sanitation District and Orange County Sanitary District projects.

Egg-shaped digesters at NYC DEP’s Newtown Creek Water Resource Recovery Facility.
The amount of heat and electricity used during the anaerobic digestion process at Newtown Creek was based on information provided by NYC DEP. The model assumes that all the biogas generated would be cleaned and injected into the natural gas pipeline as Renewable Natural Gas (RNG). The amount of energy needed to run the biogas clean-up and injection system is taken into account for these options.
For Option 3, after dewatering to 35% solids through the relatively energy-intensive Zimpro process, the digested SSO was directed, now at a much lower mass, to the same mix of disposal options as was used in Option 1. For Option 4, the SSO was land applied as Class B biosolids on agricultural land assumed to be a 400-mile round trip by truck from the dewatering facility. And for Option 5, the dewatered SSO was assumed to be composted at an aerated static pile composting operation, also without a biofilter, also a 400-mile round trip by truck from the dewatering facility.
For all five options, the carbon intensity of electricity used in the calculations was 320 g/kWh, which was provided to Northern Tilth by the NYC DEP. The global warming potential (GWP) used for methane (CH4) and nitrous oxide (N2O) were 25 and 298, respectively, consistent with the International Panel on Climate Change (IPCC) AR4 GWPs for a 100-year time frame. Biogenic CO2 emissions were not included in the accounting. This is an approach that most GHG emissions models take because biogenic CO2 moves quickly through the carbon cycle as compared to non-biogenic CO2.
GHG Model Results
Figure 2 illustrates GHG emissions associated with the five pathways for the 50,000 wet tons of NYC SSO modeled. Figure 3 shows emissions by pathway on a per dry metric ton (Mg) basis. Results of the GHG modeling indicate that anaerobic digestion of the SSO followed by land application or composting of the dewatered digestate have the lowest carbon footprints; the results from both options are very similar. Diverting SSO directly to composting also has a low carbon footprint, almost as low as the two digestion-to-recycling options. On the other end landfilling has the highest carbon footprint. With the assumptions used in the model, digesting the SSO and then disposing of the dewatered SSO in a landfill results in a net negative (good) carbon footprint, but not as good as the recycling options.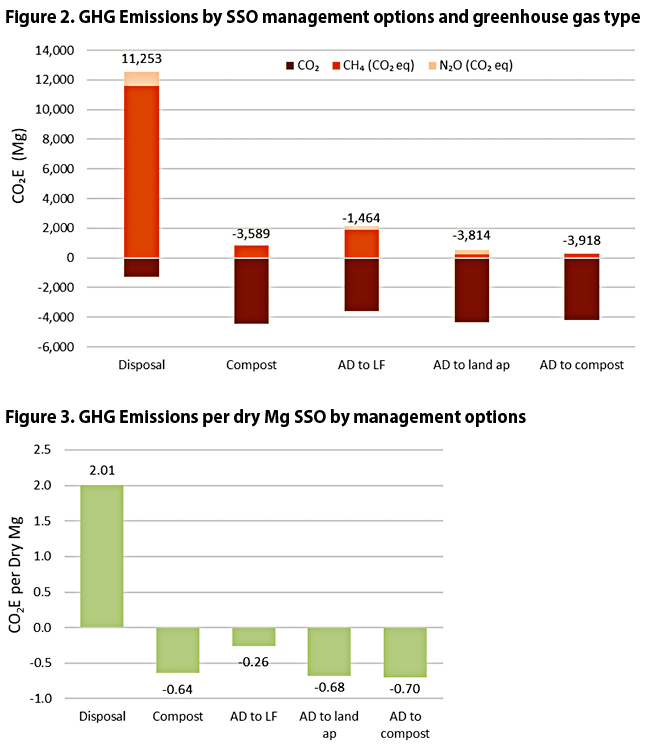
As is evident in Figure 2, the main source of emissions in Option 1, “disposal,” is the methane generated during landfilling. The SSO has a high volatile solids content and is readily degradable. Consequently, placing the undigested SSO in a landfill (a relatively high-moisture, low-oxygen environment) induces the transformation of organic carbon to methane. The portion of the disposed SSO going to combustion had minimal impact on the overall footprint for Option 1.
For the SSO going directly to composting (Option 2), the biggest carbon benefit is from carbon sequestration of the finished compost being used as a soil amendment. Another benefit from the composting option is the Scope 3 benefit, a value chain-associated emission not directly controlled by NYC DEP. It accounts for adding organic matter-based nitrogen and phosphorus to soils in the finished compost and, consequently, eliminating the need for the production of the equivalent amount of synthetic nitrogen and phosphorus fertilizers and eliminating the associated GHG emissions.
The largest benefit from all three of the anaerobic digestion options is the replacement of natural gas supplied by utilities to consumers with the biogas/RNG. For Options 4 and 5, there is the additional benefit of carbon sequestration of the remaining SSO carbon when land applied as a soil amendment, and some additional Scope 3 credits for replacing nitrogen and phosphorus fertilizers via land application of the final digestate or compost. GHG debits come from methane and nitrous oxide emissions and fuel use during composting and land application.
For Option 3, anaerobically digesting the SSO limits the GHG emissions associated with landfilling undigested SSO in two significant ways. First, digestion of the SSO reduces the mass of the material by 65% on a dry weight basis, and consequently, much less material is landfilled. Also, because the readily degradable volatile solids have been destroyed during the digestion process, the remaining volatile solids are less prone to transforming to methane in a landfill setting. There are still substantive methane emissions estimated to be generated during landfilling, but those emissions are outweighed by the benefits provided by anaerobic digestion, making the overall footprint of this option carbon negative (Figure 3).
GHG emissions associated with transportation of SSO in the five options modeled are a relatively low percentage of total emissions. The highest percentage of transportation emissions out of overall emissions is 4% for the direct-to-compost option.
As discussed above, Northern Tilth’s modeling includes some Scope 3 GHG emissions, including GHG costs associated with the production of polymers used in dewatering and avoided GHG emissions associated with the replacement of nitrogen and phosphorus fertilizers when composting or land applying the SSO. For some GHG accounting protocols, Scope 3 emissions are not included. In all five scenarios, Scope 1 encompasses the majority of emissions. With the exception of the compost scenario, which has negligible Scope 2 emissions, Scope 1 emissions > Scope 2 emissions > Scope 3 emissions. Figure 4 shows the breakdown of emissions by scenario and scope.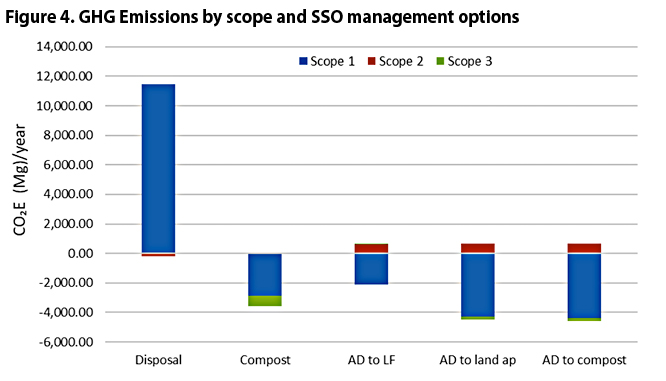
Model Sensitivity
To demonstrate the impacts of changes in management options and GWP timeframes, Northern Tilth ran the BEAM model using the following changes to the model inputs:
- Flaring 100% of the biogas instead of cleaning the gas and injecting it into the natural gas pipeline
- Using the carbon sequestration credit from an updated literature review
- Looking at the impact of carbon-free electricity that NYC is striving for in the future on the total GHG estimates
- Directing all landfilled material to landfills with aggressive capping and methane capture strategies
- Using a Global Warming Potential (GWP) time frame of 20 years instead of 100 years
Relative to the five pathways for SSO management, the adjustments reviewed in the sensitivity analysis suggest the following:
- Option 1 (disposal): Sending SSO to a landfill with an aggressive methane capture strategy significantly reduces GHG emissions. Conversely, because methane is the largest contributor to this management option, when looking at emissions for this option using 20-year GWPs, the GHG emissions more than double.
- Option 2 (SSO direct to composting): When using the lower carbon sequestration number determined for biosolids land application from an updated literature review, instead of the food waste composting carbon sequestration number from the EPA’s WARM model, composting becomes slightly carbon-positive (a net emitter of GHG) despite the benefits associated with carbon sequestration and fertilizer replacement from composting.
- Option 3 (anaerobically digesting the SSO followed by landfilling the dewatered digestate): Flaring the biogas instead of making RNG eliminates the renewable energy benefits to the carbon footprint and changes the GHG results for this option from carbon-negative to slightly carbon-positive but still only 30% of the emissions associated with direct disposal of the SSO.
- Options 4 and 5 (anaerobically digesting the SSO followed by land application or composting): Most of the sensitivity adjustments have minimal impact on GHG emissions. The exception is flaring the biogas instead of injecting RNG into the pipeline which makes both of these options become slightly carbon-positive.
GHG Emissions Summary
Using an updated version of the BEAM GHG assessment tool that has been refined specifically to model five different management options for SSO collected by NYC, Northern Tilth has found the following:
- The SSO management options with the lowest carbon footprint are anaerobic digestion of the SSO followed by either land application or composting of the dewatered digestate (Options 4 and 5).
- Managing the SSO by going directly to composting (Option 2) is also a net carbon-negative management option, with only slightly less emissions reductions than Options 4 and 5.
- Anaerobically digesting the SSO followed by landfilling the dewatered digestate still provides a net negative carbon footprint, though significantly higher than Options 2, 4 and 5.
- Managing the SSO by delivering it directly to landfills emits significant methane to the atmosphere resulting in a relatively high, net positive carbon footprint.
- When comparing the management options of diverting SSO directly to composting versus diverting the material to anaerobic digestion followed by land application or composting, some material management considerations must be taken into account, e.g. moisture content and physical contaminants in the collected SSO. EBS® manufactured at WM’s Varick Avenue CORe® Facility has a relatively low solids content, partly due to blending of SSO with commercial liquid streams including Fats, Oils and Grease (FOG) as part of WM’s CORe® process. That current mix provides a local outlet for FOG and is a suitable feedstock for anaerobic digestion but would pose some challenges if sent directly to composting.
This GHG assessment is based on the best information available to Northern Tilth during modeling. The discipline of GHG accounting is constantly evolving and some of the reference values and algorithms used in this modeling are bound to change over time. The sensitivity analysis completed as part of this project should capture some of the factors to which the results of the model are most sensitive, as well as those that are most likely to change in the future. Additionally, the GHG results from this comparison of the five scenarios for NYC are specific to operating conditions for New York City and could change when applied to other municipalities.
Romy Carpenter, a certified nutrient management planning specialist at Northern Tilth, received a B.S. in Ecology & Evolutionary Biology from Yale University in 2018, where she researched the impact of tree harvesting on forest soils, and has continued to focus on work in environmental sustainability. Romy joined Northern Tilth in 2021. Andrew Carpenter is a certified soil scientist, certified crop advisor and certified nutrient management planning specialist who has been recycling organic residuals and developing recycling programs for materials that have not historically been reused since 1992. He founded Northern Tilth, LLC, an environmental consulting firm focusing on organic waste management and building soil health, in 2003. Andrew is a trustee of the Compost Research and Education Foundation.