The implied logic is that if a supply of organic feedstock can be created, the infrastructure to process it will be built. Has that happened in New England states with bans?
Part I
Carol Adaire Jones
BioCycle September 2017
To address a gap in organics processing infrastructure, four New England states — Connecticut, Massachusetts, Rhode Island and Vermont — and more recently California, as well as a number of cities, have adopted bans on landfill disposal of food waste, or recycling mandates. Inverting the logic in the movie Field of Dreams (“if we build it, they will come”), the implied logic of the bans is that if a supply of organic feedstock can be created, the infrastructure to process it will be built. This two-part article examines whether the New England experience has fulfilled this implicit promise.
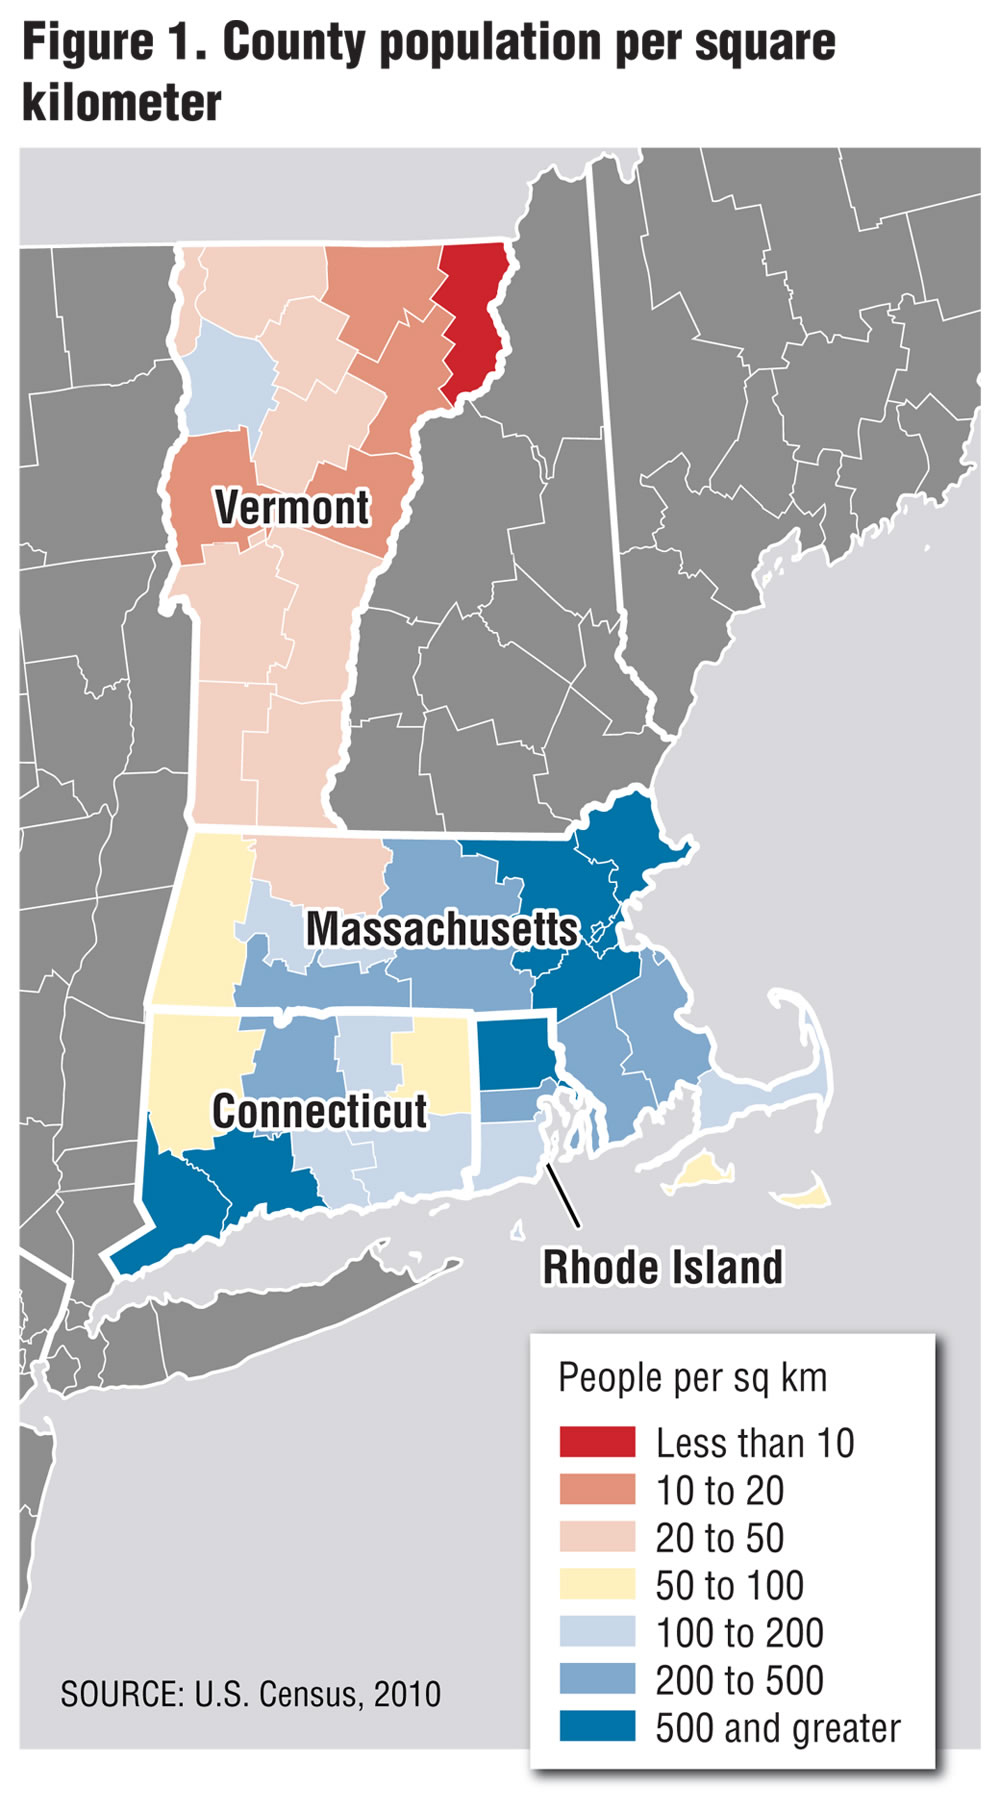
Figure 1. County population per square kilometer
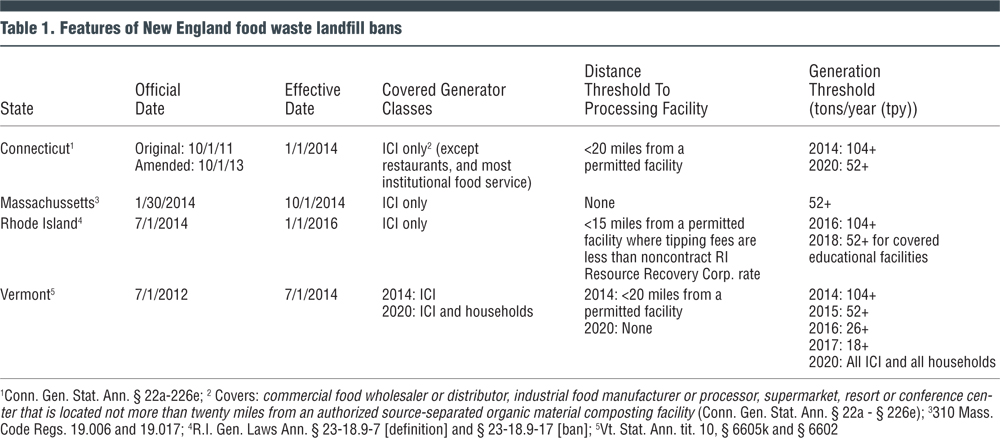
Features of the Bans
Table 1 summarizes components of the four organics bans, which went into effect in 2014 in three out of the four states, with the Rhode Island ban effective in 2016. Under a 2012 Vermont law (Act 148) establishing universal recycling in the state, food waste is the last material to be banned, following consumer recyclables, and leaves, yard trimmings and clean wood debris. Massachusetts and Connecticut already had banned yard trimmings, and Rhode Island implemented a yard trimmings recycling mandate.
The bans are similar in the sectors and size classes of food waste generators covered. Greater variation exists in several phase-in provisions, which are designed to accommodate the reality that bringing a waste processing facility online takes a substantial amount of time, in the best of circumstances. At the end of its several phase-in periods, Vermont’s ban covers all generators, which is substantially more inclusive in terms of generators covered than the other three states.
In the U.S., nonfarm generated food waste is split about half and half between households (51%) and the industrial, commercial and institutional food service sectors (ICI), which includes industrial food manufacturing (2%), commercial grocery sector (15%), restaurants (22%), and institutions serving food, such as universities, hospitals, prisons (10%) (ReFED, 2016). Massachusetts’ and Connecticut’s profiles are similar to this national estimate (Rhode Island did not have the data to make an assessment). All of the bans cover ICI, though Connecticut excludes restaurants and most institutional food service operations. Vermont diverges from the national profile — two-thirds of disposed food waste is from households. Vermont is the only state that extends coverage to households, including them at the end of its phase-in period (2020).
The bans also lower, over time, the size threshold above which a generator is covered. After conclusion of the phase-in period (if any), they typically cover facilities generating 52 tons/year (tpy) or more. (According to rules of thumb in Massachusetts’ guidance, this is likely to occur, for example, in universities with more than 730 students, restaurants with 70 or more full-time employees, and supermarkets with 35 or more full-time employees.) The exceptions are that Rhode Island shifts only covered educational institutions down from the 104 tpy to the 52 tpy threshold as of 2018, whereas Vermont expands coverage to all size generators — household and ICI — as of 2020.
Another safety valve built into the Connecticut, Rhode Island and Vermont bans is a provision waiving coverage if there is no permitted processing facility within 15 or 20 miles of the generator. Rhode Island is unique in also waiving coverage if the nearby facility is charging a tipping fee higher than the state landfill noncontract rate of $90/ton, though this is not currently a binding constraint.
Massachusetts and Vermont had made fairly robust down payments toward projected processing infrastructure needs, including composting capacity, when their bans became effective.
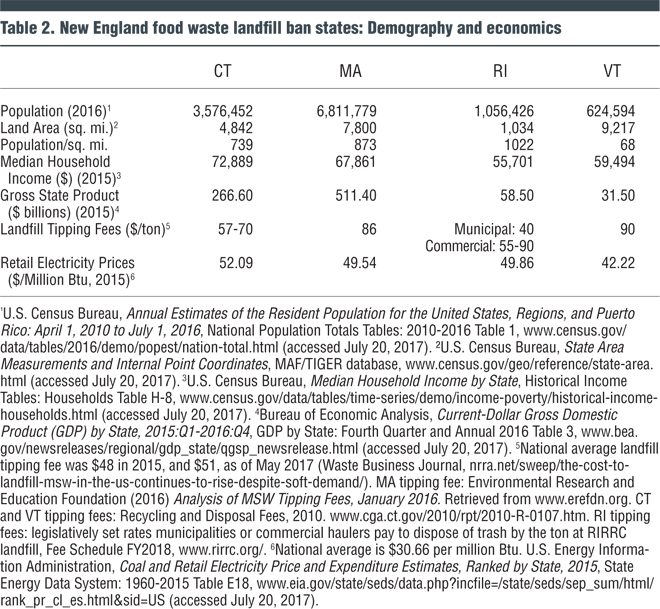
State Demographics And Economics
New England states share several underlying economic similarities that drive food waste recycling. Foremost is rapidly declining landfill and incinerator capacity relative to projected future needs under past growth paths, combined with a limited ability to site new facilities. The result is high tipping fees, averaging $79/ton (compared to the national average of $51/ton (in May 2017)). High regional electricity prices may increase the attractiveness of energy recovery from recycling.
At the same time, the demographics and economics of the states vary widely (Table 2). Connecticut and Massachusetts have much higher populations and total state economic activity, as well as higher household incomes than Rhode Island and Vermont. Higher economic activity and incomes are associated with higher levels of solid waste and potentially with greater state financial resources to support local government initiatives to expand recycling.
In addition to the smallest population, Vermont also has a much lower population density in most of its counties than Connecticut, Massachusetts and Rhode Island, each of which have municipalities that range from densely populated central cities to rural areas (Figure 1). Low population density results in a very different cost structure for the waste management sector, and may be associated with limited local budgets and part-time local governments that constrain communities’ ability to plan and deliver services.
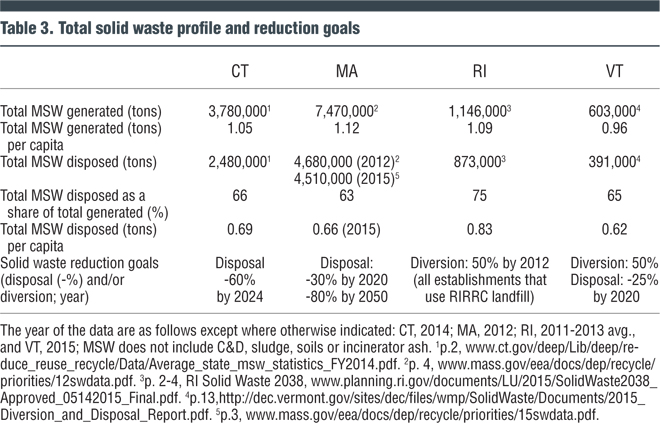
Solid Waste Profile
Across the states, tons of solid waste generated parallel population size (Table 3). The quantities of municipal solid waste (MSW) generated per capita are similar, around 1 tpy per person. (The MSW measure includes residential and commercial waste, but not construction and demolition (C&D) waste, or ash, soils and sludge.) The variation across states in estimated per capita quantities may reflect the lack of standardization in accounting procedures, e.g., the extent to which C&D waste is excluded. Connecticut, Massachusetts and Vermont dispose around two-thirds of their MSW in landfills or waste-to-energy plants. Rhode Island disposes three-quarters of its MSW, primarily at the Central Landfill owned and operated by the quasi-public state level agency, Rhode Island Resource Recovery Corporation (RIRRC).
All four states have articulated goals to reduce solid waste, though the states vary in whether they focus on reducing disposal or increasing diversion (or in some cases both), as well as in their target rates of change over time. None, however, focuses on reducing total quantity generated. Massachusetts even stopped collecting data on total solid waste generated after 2012.
Further, all have clearly identified reducing food waste as critical to reaching their goals because, as one of the largest components in the waste stream and one with the lowest diversion rate, food waste has significant diversion potential. Both Massachusetts and Vermont published assessments of the impacts of their bans and action plans with an integrated set of policies for implementing them, and subsequently have published status reports. Connecticut and Rhode Island published information regarding their plans for implementing food waste recycling goals in their long-range solid waste plans.
Connecticut anticipates anaerobic digestion will provide a significant share of new processing capacity in the state. The Quantum Biopower facility in Southington came online in early 2017.
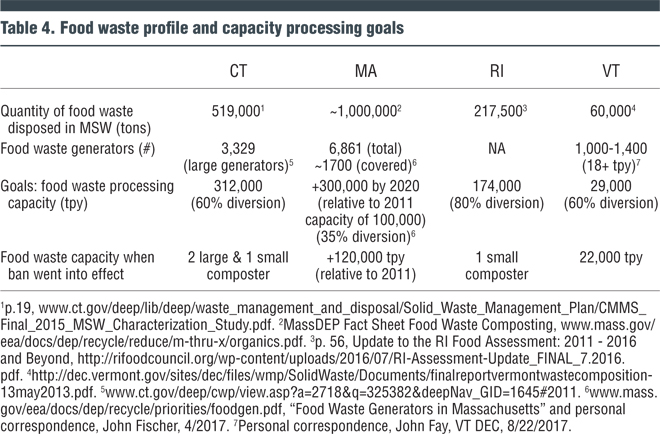
Food Waste Profile
A variety of information is essential to design plans to implement the organic bans. To estimate the quantity of food waste currently disposed, each state applied estimates of food waste shares from episodic waste composition studies to the more aggregated solid waste data reported annually (Table 4). To estimate the number of generators in a sector that exceed the food waste threshold, rule-of-thumb indicators of food waste disposal, such as number of employees or square feet of floor space, are utilized — which results in imprecise estimates on the total number of generators that fall within the compliance threshold. The implications for enforcement are that many firms are covered (i.e., above the state size thresholds). Further, effectively identifying and targeting the covered ones in a sector is challenging.
For Massachusetts and Vermont, the official state goals for total (additional) food waste processing capacity needed to accommodate diversion as a result of the bans are based on analyses of estimated feedstock supply that incorporate estimates of on-site food waste reduction as well as increased donations of edible food. For example, Massachusetts anticipates that 50,000 tpy of its goal of an additional 350,000 tpy diverted will be met by other strategies, including reduction, food donation and rescue, animal feed, and on-site systems. Given the scale of its processing needs (management of 300,000 tons), Massachusetts is looking to anaerobic digestion to provide a substantial share of the new processing capacity. Vermont explicitly addressed the regional distribution of the needed facilities. Assuming that the bulk of its organic waste will be composted, and 30 percent of the composting will occur on farms, it estimates that one centralized composting facility will be necessary for each county, complemented by a number of smaller commercial and farm-scale facilities.
For Connecticut and Rhode Island, the author has informally estimated implied capacity goals in Table 4 based on those states’ unofficial food waste goals of 60 percent and 80 percent food waste diversion, respectively, and their estimates of food waste disposed. Both states are anticipating anaerobic digestion will provide a significant share of the new capacity.
As of the date their bans became effective, Massachusetts and Vermont had made fairly robust down payments toward their projected infrastructure needs to implement the ban. Massachusetts brought on line 120,000 tpy of additional capacity out of its target goal of adding 300,000 tpy of processing capacity, bringing its total to 220,000 tpy. Vermont had 22,000 tpy online out of its goal of 29,000 tpy. Connecticut had three composting facilities — two large and one small — with total capacity close to 200,000 tpy. Food waste represented a small share of the organics being processed. Rhode Island identified its collection and processing capacity for food waste as “virtually nonexistent” on January 1, 2016.
With this level of infrastructure development, the facility distance-based waiver for covered generators was triggered in three states with this feature, until more processing capacity comes online (or for Vermont, 2020, if it comes first). However the waiver affected a much smaller share of generators in Vermont than in Connecticut, or particularly Rhode Island.
Carol Adaire Jones, an environmental economist and Visiting Scholar at the Environmental Law Institute (www.eli.org), is Co-Director of ELI’s Food Waste Initiative. She can be reached at jones@eli.org. Part II of this article reviews changes in new facility development and utilization of old facilities for food waste processing following enactment of the bans, and highlights stakeholder perspectives on what factors were key to expanding capacity in their states.
.