Nora Goldstein
Residents in the City of Napa, California (pop. 79,260) have had access to single stream recycling and green waste collection for many years. In 2015, after conducting several pilot programs, all households with curbside collection were allowed to include food scraps and soiled paper in their brown organics carts. The curbside program is serviced by Napa Recycling & Waste Services (NRWS), which has a contract with the City of Napa to provide weekly collection service of recyclables, organics and trash. NRWS offers pay-as-you-throw pricing for trash collection to help incentivize separation of recyclables and organics. Weekly recycling and organics collection service is free (up to 2 carts for recycling and 2 for organics).
NRWS also services Napa businesses. Single stream recycling and yard trimmings (up to a certain size) collection is offered along with their garbage service at no extra charge. Food composting service is also available to all businesses at a rate that is reduced 25% from commercial trash rates. Businesses diverting food waste are provided either 35 or 65-gallon green carts. For indoor collection, the City of Napa supplies various size containers (23-gallon and smaller). These are emptied into the larger carts outside. According to NRWS, over 200 tons/month of food waste are collected for composting from participating businesses.
Offering food scraps collection coincided with California Assembly Bill 1826 (Mandatory Commercial Organics Recycling) that requires businesses generating organic waste materials (which include food waste, green waste, landscape and pruning waste, clean wood waste and food‐soiled paper) to separate the material for composting. Compliance with the requirement has been phased in — initially based on presumed organic waste generated and now on all solid waste generated each week. As of January 2021, businesses generating 2 cubic yards or more of solid waste/week must separate organics for recycling. (The first phase, effective in 2016, covered businesses generating 8 cy/week or more of organic waste.)
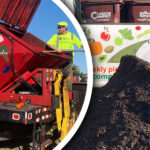
The City of Napa owns the composting and recycling facility — located on the same footprint — where all residential and commercial recyclables and green waste/food waste are processed. The City contracts with NRWS to operate these facilities. The 18.6-acre site is in an industrially developed area of unincorporated Napa County. The Materials Recovery Facility is on 1.2 acres; about 12 acres are used for handling organic materials (Solis, 2016).
Tackling Contamination
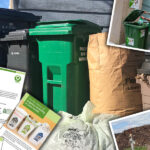
The City of Napa is like many municipal curbside programs that face contamination from nonrecyclable and noncompostable items in the residential recycling and organics carts. It also faces the challenge of how to increase participation in household food waste diversion (again, a common challenge with many residential food waste collection programs in the U.S.). It has utilized stickers on carts, hanging oops tags, and other messaging tools to educate households about proper separation and what materials are allowed in the recycling and organics set outs. Accepted items in the organics cart (brown colored) are all food items (including meat/bones, dairy, bread, fruit and vegetables), food-soiled paper, paper cups and plates, paper towels and napkins, coffee grounds and filters, tea bags and yard trimmings. Households can use BPI-certified compostable bin liners.
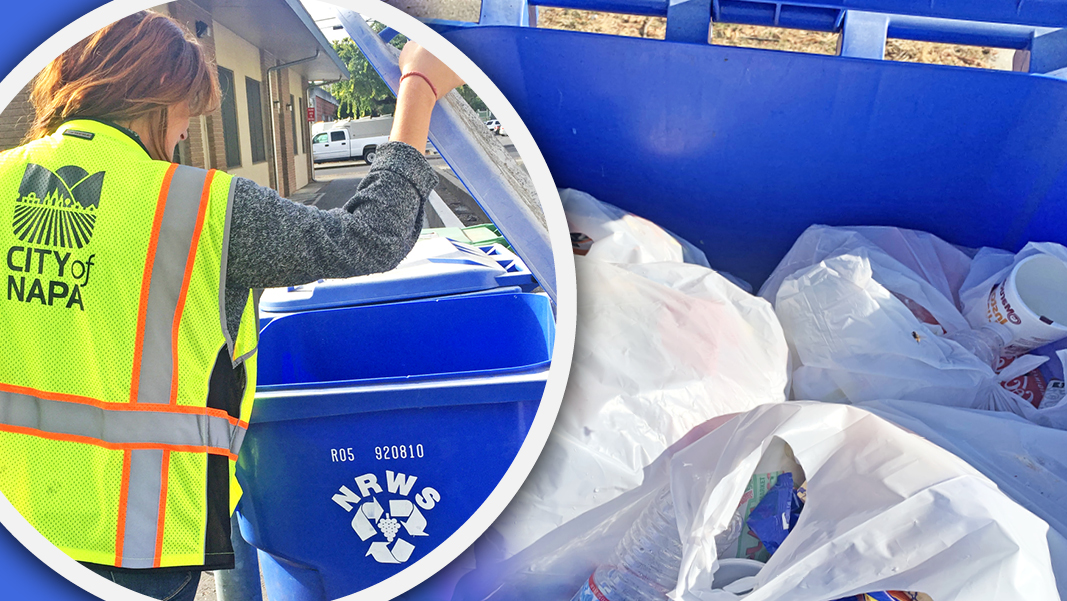
Inspired by seeing some presentations by The Recycling Partnership on assessing contamination curbside, it was decided to conduct a “Flip-The-Lid” pilot audit in October 2018 to collect data on the types and amount of contamination in the residential carts. A message to residents was posted on the city’s Facebook page: “The City of Napa Recycling Division will be coming around ‘peeking’ into recycling, compost and trash carts throughout town the next two weeks to see how they can better assist in the confusion surrounding what goes where! So if you see someone in a ‘City of Napa’ vest looking into your recycling or compost cart, don’t be ‘spooked’! …. It is solely a visual check to see what items do and do not belong in those carts.”
The initial pilot included 1,232 homes in 5 different neighborhoods; carts were visually inspected in each neighborhood during one week. Six City of Napa staff members went out at 6:30 AM, coordinating with NRWS. As the week went on, staff became more familiar with which carts to tag based on their visual inspections — and how many to tag overall. Recycling carts with 5% or less contamination received a “Great Job” sticker. Recycling carts with 20%+ contamination received a “oops tags” that were hung on the cart handles; ones with 40%+ contamination received an oops tag and were turned around so they would not be emptied by NRWS. City staff filled out forms, and all the data collected was entered into Excel spreadsheets. The following was compiled:
- Organics Carts: Out of 1,232 homes, a total of 689 organics carts were set out (56% setout rate). Of the 689, 87% included yard trimmings, 30% included food scraps, and 14% included soiled paper. Percentage of contamination was as follows: Painted wood-8%; Dog poop-1.8%; Other-5%; and Film plastic-0.2%.
- Recycling Carts: Out of 1,232 homes, a total of 1,046 recycling carts were set out (85% setout rate). Percentage of contamination was as follows: Film/soft plastic-61%; Soiled paper-26%; Pizza boxes-10%; Food-8.9%; Styrofoam-8.3%; Textiles-6.9%; eWaste-1%; Other-0.09%.
In addition to insights on setout rates and amount of contamination, the City of Napa learned that trying to collect all this data using paper forms was unmanageable. “It was overwhelming to input the data collected by hand, and make sure everything was entered correctly,” recalls Kendra Bruno, Waste Prevention Specialist with the City of Napa Recycling Division. “We were already working with a company called Recyclist, which has a product called Program Tracker that provides digital tracking and analytical tools for residential and commercial programs like ours. Recyclist had already created our digital commercial audit form, so we asked if they could make our flip-the-lid audit form digital as well.”
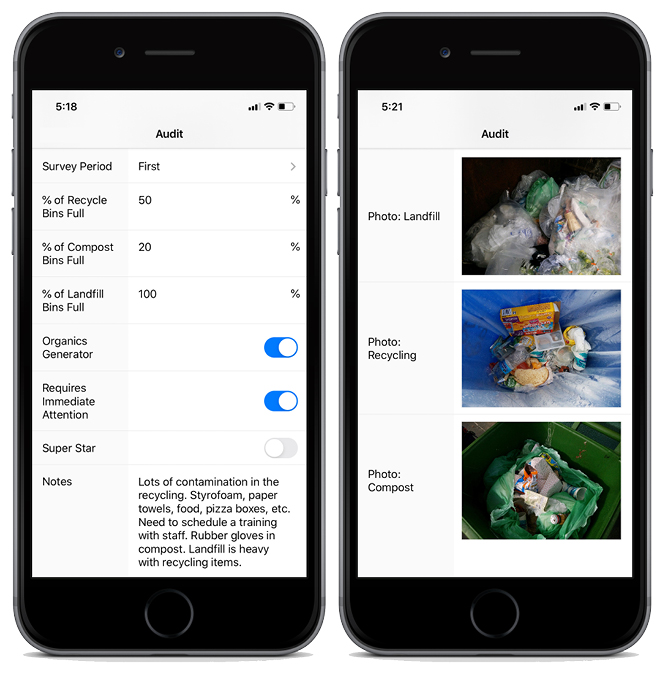
Contamination notes (left) and photos (right) in Program Tracker. Photos courtesy of Recyclist
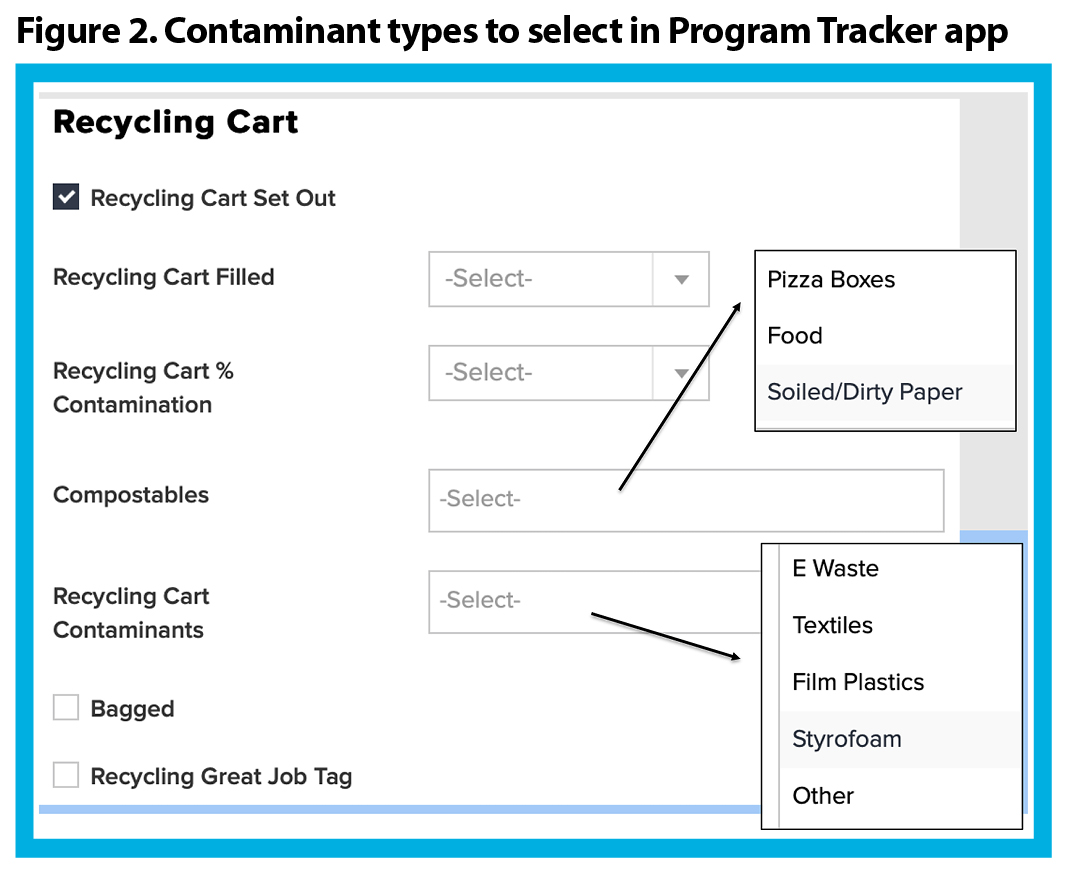
The module was created and added to the City of Napa’s Program Tracker in February 2019. Figures 1 compares the paper form versus the digital form. Figure 2 has screen shots of the digital forms for recycling and organics. “Most of the applications for the Program Tracker are to monitor contamination in commercial bins,” explains Emily Coven, founder of Recyclist. “But we are working with a growing number of jurisdictions that are motivated and determined to get out ahead of contamination in the residential streams before they have to begin enforcing compliance under the SB 1383 law. Our goal is to have all of the communities with the Program Tracker app for residential and commercial applications utilize a common list of contaminants so they will be able to compare the effectiveness of various strategies to eliminate contamination in the recycling and organics streams.”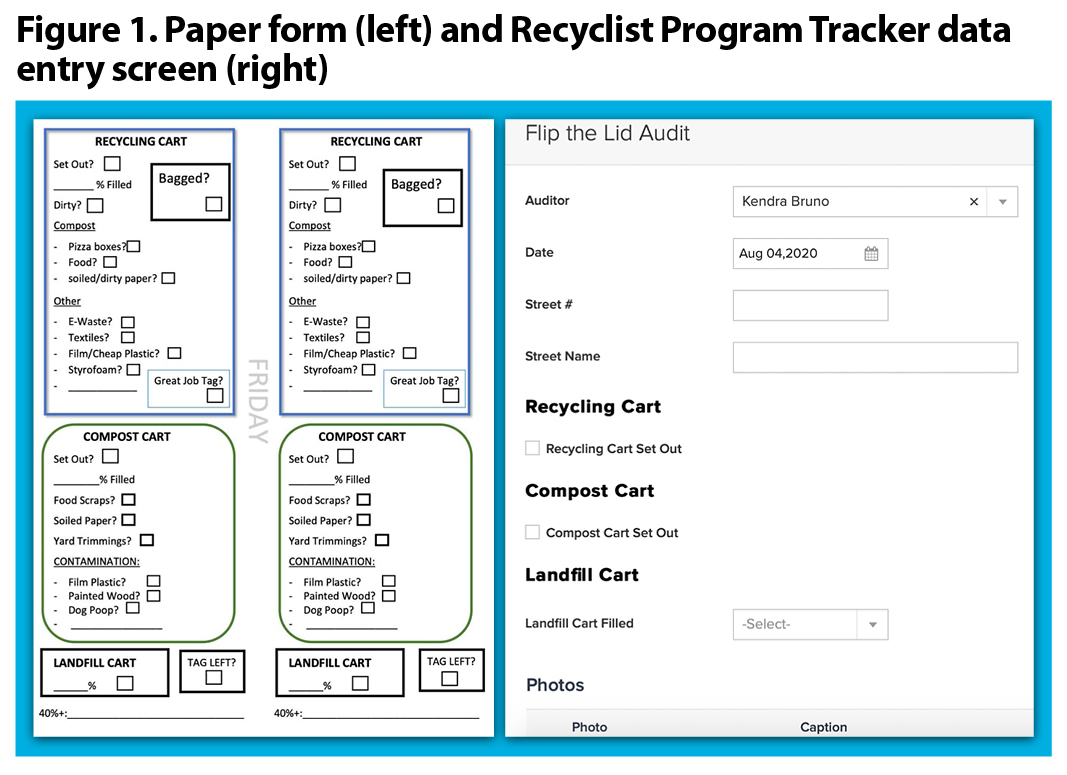
Employing CBSM Tools
For its next pilot, the City of Napa wanted to utilize community-based social marketing messaging to tackle contamination in the recycling carts. Community-based social marketing (CBSM) pairs basic principles of psychology with applied research methods in a way that provides a usable framework for practitioners working to promote behavior change across a variety of settings, explained Jennifer Tabanico and P. Wesley Schultz in a 2007 BioCycle article: “CBSM begins with the selection of a specific target behavior and then uses a four-step process to foster sustainable behavior change: 1) Identifying the barriers to a targeted behavior; 2) Using behavior change tools to overcome the barriers; 3) Piloting the selected tools using empirical research methodology and a control group; and 4) Evaluating the project once it has been widely implemented.”
In 2019, the City of Napa Recycling Division ran 3 different pilots to test various CBSM messaging tools targeted at the recycling stream — postcards, cart stickers, and postcard vs. cart sticker. Some of the tools used, e.g., tags, postcard, were customizable graphics provided by The Recycling Partnership from open source downloads.
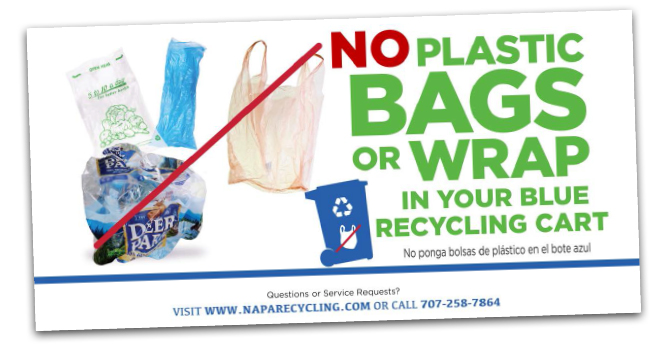 Postcard Message Comparison: In January 2019, the Recycling Division tested mailing two postcards to households, each with a different message. One postcard had the headline, “No Plastic Bags or Wrap In Your Blue Recycling Cart,” with photos of the various bags; the other had the headline, “Landfill Soft Plastics” with photos identifying soft plastic items such as chip bags, film plastic and sandwich bags. “The main messaging difference is that the No Plastic Bags or Wrap card told households NOT to put film plastic into their recycling carts, while the Landfill Soft Plastics card was very specific as to which cart soft plastics should go in,” explains Bruno.
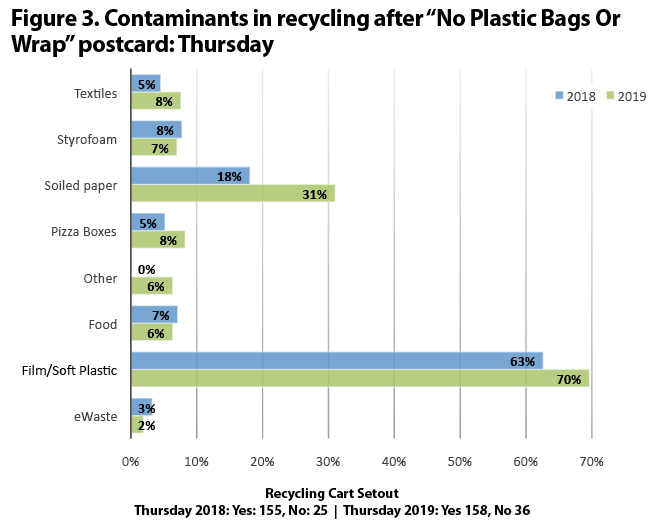
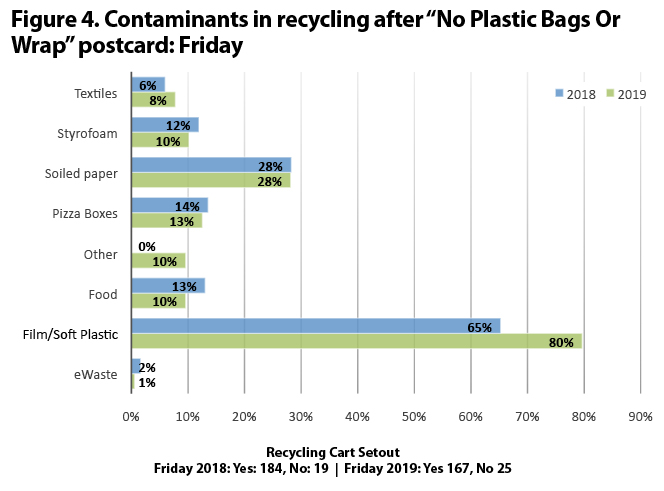
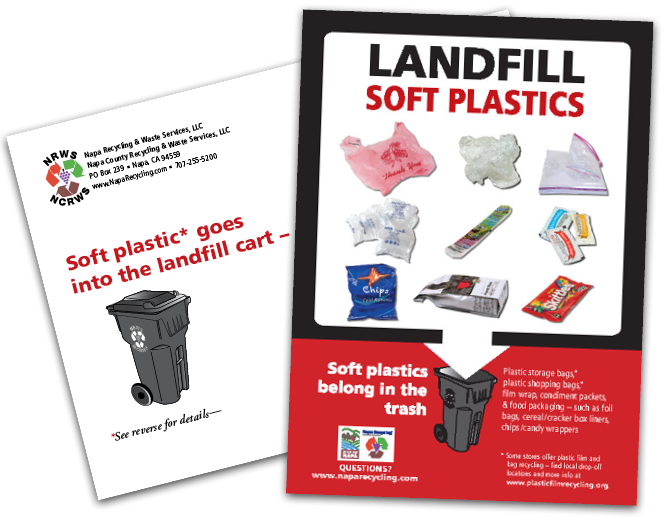 The No Plastic Bags or Wrap postcard was mailed to homes with Monday, Wednesday, and Thursday recycling collection. The Landfill Soft Plastics postcard was mailed to homes with Tuesday and Friday recycling collection. All data were collected using Program Tracker. Thursday and Friday neighborhoods were then audited. Figures 3 and 4 show the results, comparing contaminant levels between the pilot in October 2018, with the first CBSM pilot in January 2019. With both postcards, the percent of film/soft plastic contamination in the recycling carts increased, by 7% with the No Plastic Bags or Wrap postcard, and 15% with the Landfill Soft Plastics postcard. Interestingly, the amount of soiled paper in the No Plastic Bags or Wrap postcard route increased by 13%, whereas in the other, it stayed at 28%. All in all, there was not a statistical difference between the postcard messages or a change in recycling behavior with regard to contamination.
Stickering Recycling Bins While Auditing: The second pilot tested putting a sticker on all recycling bins with the message to Keep Your Recycling Clean and highlight materials not accepted (Figure 5). The stickers were applied while doing a recycling cart audit on May 23, 2019. Door to door outreach was conducted on a small street of about 12 residential units. Staff went out again on June 13, 2019 to measure the effectiveness of the sticker put on the recycling carts. Bins with 40%+ contamination were not serviced and NRWS was notified to leave them.
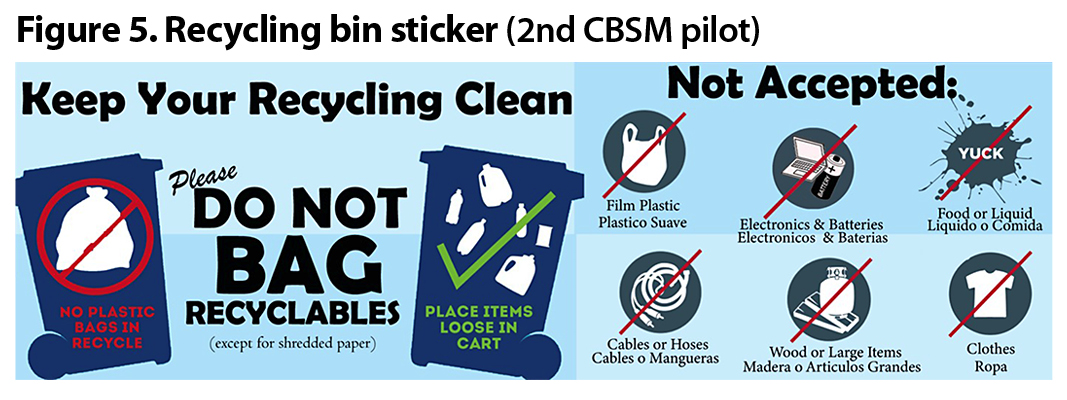 Figure 6 shows the findings. The number of carts set out was about the same (264 in May and 269 in June). The amount of food (10%) stayed the same, as did “Other” (14%). Textiles decreased by 2% (from 11% to 9%). There were slight increases in film/soft plastic (74% to 77%) and soiled paper (27% to 30%). Larger increases were found in pizza boxes (11% to 17%) and Styrofoam (8% to 16%).
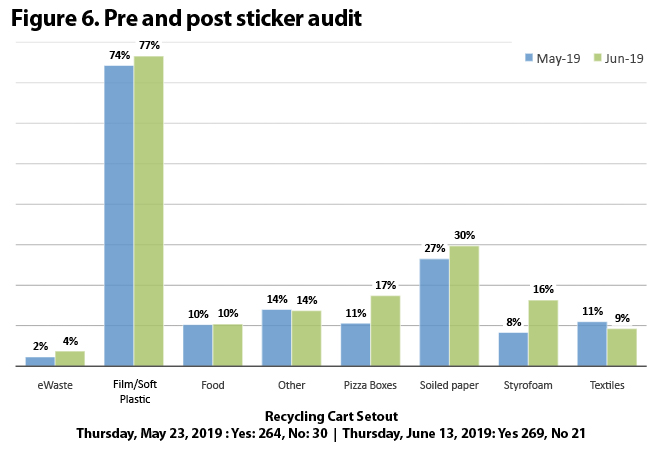
Postcard vs. Sticker: The third pilot tested the No Plastic Bags or Wrap postcard as compared to the Keep Your Recycling Clean sticker with the same set of households that received the sticker. The postcard was sent at the end of July/early August 2019. Figure 7 includes the results for all three of the CBSM pilot tests — postcard only (May 2019), sticker only (June 2019) and sticker+postcard (Sept. 2019). There was a 6% drop in the number of pizza boxes (from 17% in June to 11% in Sept.) and a jump in soiled paper (30% to 40%) — both items that can be placed in the organics cart. Film/soft plastics declined by 8%.
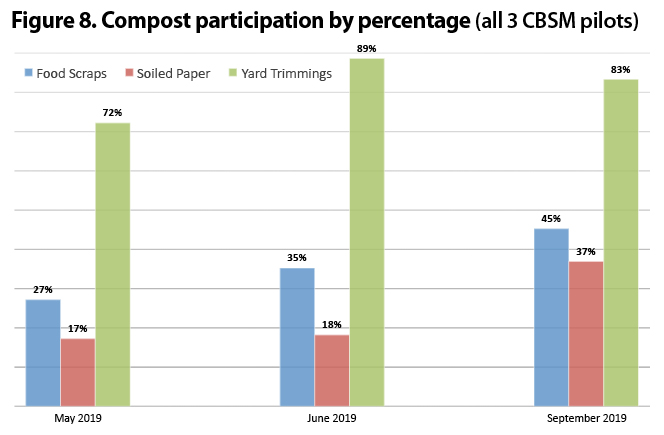
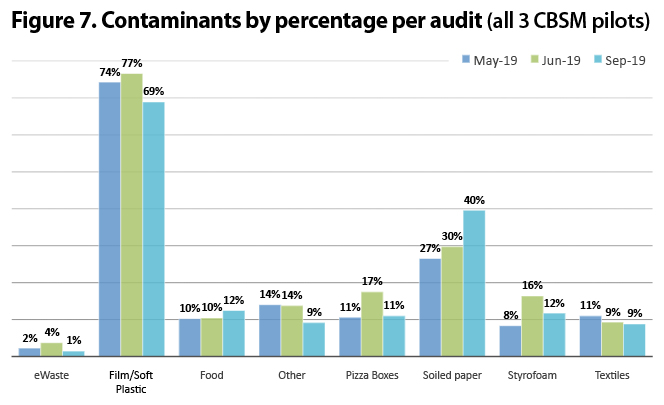 Figure 8 assesses items in the organics cart over the same months — May, June and September. The percentage of food waste gradually increased in the carts; the amount of soiled paper doubled between June and September. “The compost carts, like the recycling carts, were visually audited each time,” explains Bruno. “We tend to get an increase in the amount of food organics set out during August and into the fall, but cannot explain why.”
 CBSM Pilot Takeaways
Generally speaking, the City of Napa did not see a statistically significant change in household behavior as a result of the CBSM pilots. “Due to increased film plastic following the mailing of two different postcards in different neighborhoods, we found the passive education of a postcard was not effective in reducing film plastics in recycling carts,” says Bruno. “Perhaps the extended lag time between the audits was a factor in measuring the effectiveness of each strategy. But truly, plastics are too confusing, even with the additional outreach. The chasing arrow recycling symbol is on film plastic packaging, for example, even though film plastic items have to go to the landfill.”
She adds that “wishcycling” is strong, “particularly in our region where recycling is a very popular, ‘right’ thing to do. We also spent a lot of time being too lenient about what the city accepts in the recycling and organics carts thus the contamination behavior has become pretty engrained.” Bruno and others on the NRWS team believe that film plastic is so ubiquitous that it gets into the recycling even when you don’t try to — for example, plastic packaging inside a shipping box. This has led them to conclude that the only way to get rid of single use plastics is a ban, or some type of fee on their use.