Sally Brown, Andrew Carpenter and Lauren Souther
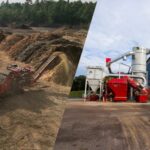
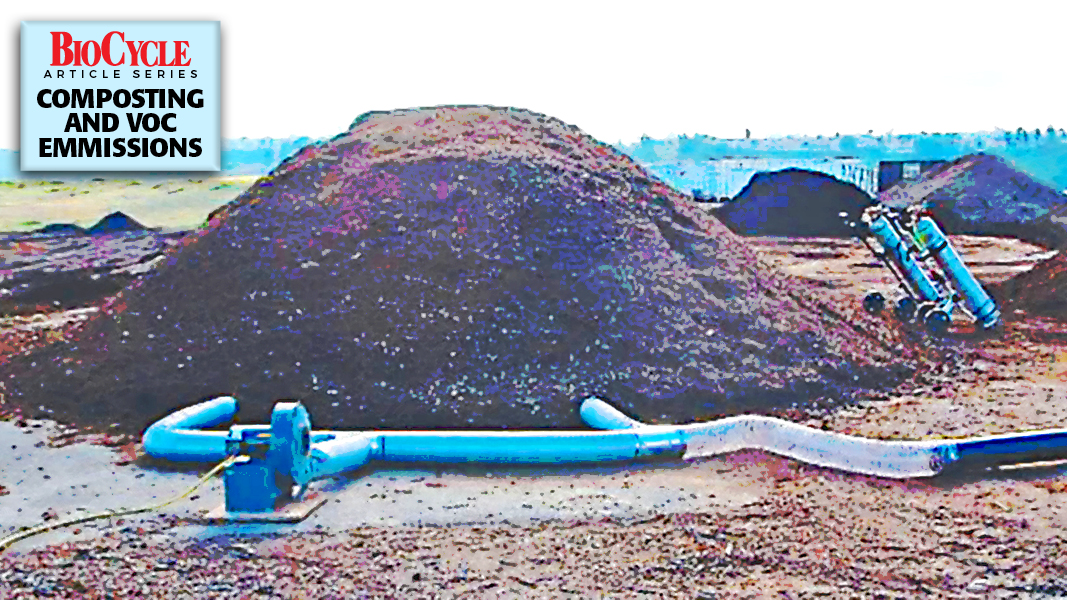
Image — from 2012 BioCycle article by C.E. Schmidt and Tom Card — is a pilot-scale test on utilizing a positive aerated static pile for a biofilter layer.
Current regulations requiring measurement of volatile organic compounds (VOCs) for composting are problematic for two reasons. First, the price tag for compliance with the regulations can be very expensive. Second, for cases where default Emissions Factors (EFs) are used, the data that these are based on is limited, older and not correlated to process conditions within the pile (which is a key driver of emissions). Because of this, predicted VOC emissions based on the defaults are often high, which can result in limits to the size and tonnage a facility is permitted to accept.
Part I of this series covered the basics — what are composting VOCs and how are they measured. Part II takes a deep dive into the regulatory landscape. To understand the full impact of these regulations, we interviewed composters in the western U.S. who have to comply with regulations on VOC emissions, both with actual measurements and based on default values. In both cases, these regulations have been seen as a constraint to the larger goal of organics diversion from landfills and expanding use of composts to promote soil carbon sequestration and soil health (Thao et al. 2011).
Required Sample Collection
The South Coast (California) Air Quality Management District (SCAQMD) standard for VOCs requires sample collection and analysis using a gas chromatograph, flame ionization detector (GC FID) with separate analysis for ammonia. A flame ionization detector (FID) is used to calculate the VOCs based on how much carbon has burnt for each sample (SCAQMD, 2000). This protocol results in three separate analyses for two air samples from one sampling event, adding to the time requirements and costs for regulatory compliance. The sampling method costs between $1,000 and $1,500 per sample location according to operators of the larger facilities that we interviewed. For smaller operations that require fewer samples, the cost per sample can be considerably higher.
Depending on the size of the facility, dozens of samples can be required. Current regulations in southern California require that emissions are analyzed every 2 years for non-methane, non-ethane organic compounds (NMNEOC) and ammonia (NH3) using SCAQMD Methods 25.3 and 207.1. Measures of both uncontrolled and controlled emissions are required. Control methods that are accepted include forcing air from compost piles through a biofilter and covering piles with cured compost during the composting process. An 80% reduction in emissions from controlled piles is required to comply with regulations.
For one of the larger facilities we spoke to, emissions testing requires collection of 50 to 70 samples, at a cost of well over $50,000. The compost at this facility is made from biosolids and yard yard trimmings in an indoor aerated static pile system. The facility uses a biofilter to control emissions and easily sees over 90% reduction in VOCs and NH3. Table 1 provides results from that facility across multiple years of sampling.
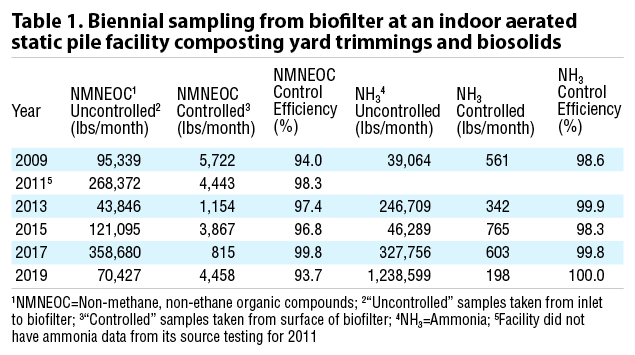 These numbers tell you two things: that emissions measures, even with multiple samples vary widely and that the biofilter does an excellent job controlling them. Remember here as you look at data that averages between 43.8 to 358.6 thousand lbs per month that the feedstocks and composting process remained the same at this facility across the sampling times. Taking air samples using very small chambers at single points in time across a large facility means it is difficult to get an accurate picture of actual emissions. Also notice that even with this variability, the biofilter was able to consistently reduce emissions by over 90%, well within the legal requirement. We talked to another facility that covers its piles with cured compost as a control device and found similar reductions in emissions.
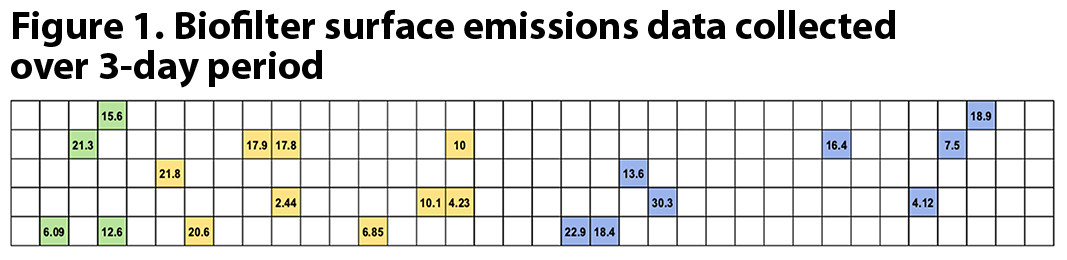
Another example to illustrate the high variability is a diagram showing emissions data collected from a biofilter (Figure 1). Samples were collected via Method 25.3 across a biofilter surface. Each colored square shows a separate sample location. Different colors represent different sampling dates over a three-day period. White cells show the areas that were not sampled. Outliers were excluded from the figure. The average of the shown results was 14.26 ppmv (parts per million by volume), with a minimum of 2.44 ppmv and a maximum of 30.3 ppmv. The sample standard deviation was 7.41 ppmv. This shows that even from a biofilter, there is high variability in results; variability within a single pile, with hot spots, etc. has the potential to generate even higher emissions variability.
 Default Factors
In other districts, default emission factors (EFs) are used to estimate total compost emissions in lieu of sampling or to limit sampling for regulatory compliance. In the case of limited sampling, some districts only require composters to measure emissions from biofilters (CARB, 2015). Results from biofilter samples are compared with published emission factors for uncontrolled emissions to confirm that facilities are meeting the required 80% reduction in emissions. In other cases, no sampling is required. Emissions from facilities are estimated based on default factors. This eliminates the costs associated with sampling. However, the default factors can over or underestimate likely emissions. If default factors overestimate potential emissions, the expansion of facilities or building of new facilities can be prevented, solely based on predicted emissions. In fact, some of the emissions factors used by some air districts are based on data from composting facilities before biofiltration or any other control technologies were implemented.
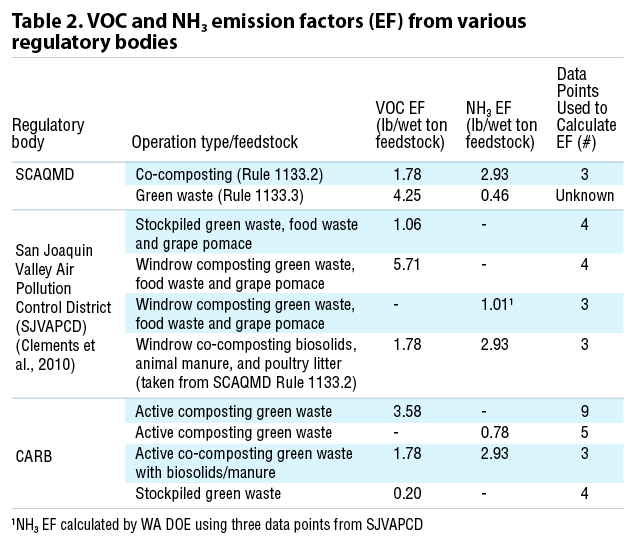
Emission factors for different districts as well as the from the California Air Resources Board (CARB) are shown in Table 2. As indicated in the table, the EFs are derived from a very limited number of samples. In some cases, these EFs, drawn from older studies, are being used for permitting current projects in California and other western states.
 When older and limited data are used as a basis for permitting new facilities, especially facilities that have access to newer control technologies, problems can occur. Operators of a Washington state composting facility that we interviewed for this investigation are in the process of expanding their current operations to meet the growing demand for organics management in both Washington and Oregon. The permitting process for the expansion proved to be significant both in terms of cost and technical resources required to address emissions-related questions.
The size of the expansion was ultimately limited by the Washington Department of Ecology (DOE) based on assumed emissions derived from the SJVAPCD EF of 5.71 lbs VOC/wet ton feedstock and 1.01 lbs NH3/wet ton feedstock. The EFs are based on emissions data from 3 to 4 data points taken from facilities with less emissions control than will be used at the facility in question. These factors ended up reducing the size of the expansion, in terms of tonnage of feedstock that the facility could accept. In this case, not only were the EFs used to determine the maximum facility size based on a limited data base, they didn’t take into account the emissions control technologies currently used by this composter.
Composter Interview Takeaways
Regulations of VOCs from composting are required in some areas and are starting to be required in others. The two types of regulations that are currently commonly used involve either required testing of total VOCs or are based on emissions factors from older studies. In both cases, problems exist. For cases where sampling is required, the expense associated with testing can be prohibitive. The limited results we saw for this review showed high variability, likely the result of taking point-in-time samples from a very small area from large operations. The results that we were able to see also suggest that emissions control techniques including biofiltration and capping with finished compost were highly effective in limiting emissions.
For cases where default factors are used, the limited data from which those factors are derived can turn a potentially good option into an obstacle for expanding composting operations. While assuring that composting does not degrade air quality is critically important, it seems as if the current regulatory structure may not offer the best way of keeping composting operations growing while still maintaining air quality.
Next up in Part III — potential solutions to composting air emissions testing constraints.
Sally Brown, BioCycle’s Senior Adviser and long-time Connections columnist, is a Research Professor at the College of the Environment at the University of Washington. Andrew Carpenter is a certified soil scientist, certified crop advisor and certified nutrient management planning specialist. He founded Northern Tilth, an environmental consulting firm focusing on organic waste management and building soil health, in 2003 and has been recycling organic matter-based by-products since 1992. Lauren Souther is a research scientist and nutrient management planning specialist at Northern Tilth. She received a BS in Wildlife Biology from Unity College in 2017.
Authors’ Note: This article series is based on a report developed for the Composting Council Research and Education Foundation (CCREF) and funded with donations from the composting industry.