Nora Goldstein
In 2014, the U.S. Environmental Protection Agency (EPA) began building a dataset of names and locations of anaerobic digestion (AD) facilities processing food waste to better understand the practice and prevalence of food waste digestion in the United States. In December 2016, EPA was granted the authority to survey digesters annually for three years, from 2017 – 2019. This report, “Anaerobic Digestion Facilities Processing Food Waste in the United States (2017 & 2018),” is the third in a series of three reports. Each report includes data for three types of AD facilities: (1) Stand-alone food waste digesters; (2) On-farm digesters that codigest food waste; and (3) Digesters at water resource recovery facilities (WRRFs) that codigest food waste. In September 2018, the first report was published, which had 2015 data; the second report (2016 data) was published in September 2019. EPA administered the survey for a third time in 2019 and the data collected from the 2019 survey (total of 117 respondents) is summarized in the recently released report, written by Melissa Pennington, Sustainability Coordinator in EPA’s Region 3 office, who conducted all three surveys.
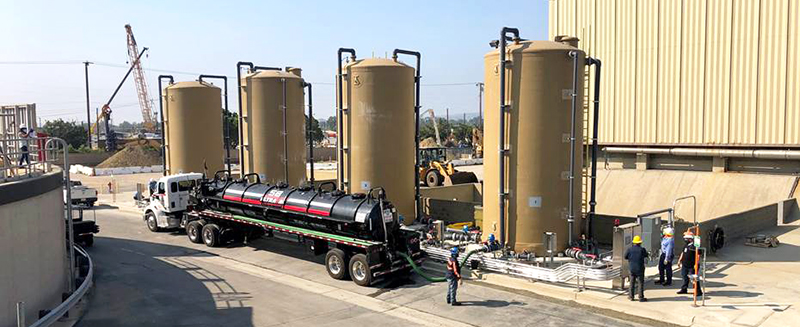
Food waste slurry receiving facility at the Los Angeles County Sanitation Districts’ WRRF has two offloading stations, each with two storage tanks. Photo courtesy of the LA County Sanitation Districts.
Three critical data points are reflected for CY2017 and CY2018: the amount of food waste processed, the amount of non-food waste processed, and the amount of biogas produced. The remaining data points reflect circumstances in 2019, writes Pennington: processing capacity, feedstock types, feedstock sources, tipping fees, preprocessing/depackaging, operational specifications, biogas uses, gas cleaning systems, solid digestate uses, and liquid digestate uses. The data used in this report were voluntarily submitted by survey respondents.
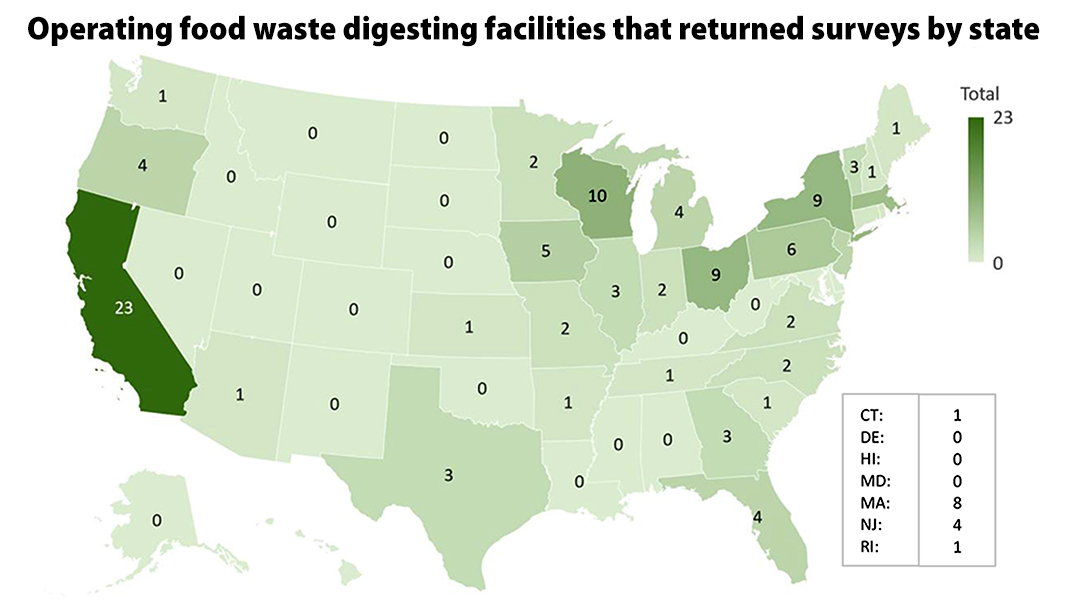
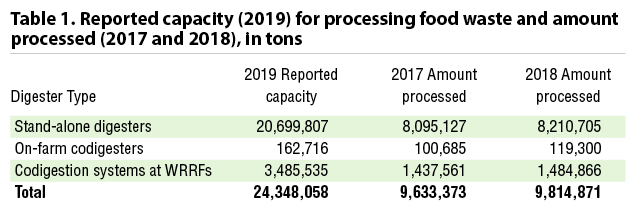
Based on the 2019 survey responses, 30 states have at least one operating digester accepting food waste (see map at the top of this post). California has the greatest number of operating codigesters (23) followed by Wisconsin (10). Ohio and New York both have nine codigesters, Massachusetts has eight and Pennsylvania has six. The rest of the states have five or fewer operating codigesters. When aggregated, the top five feedstock sources for ADs in the U.S. in 2019 in order were: Food/beverage processors; restaurants and foodservice; grocery stores/supermarkets; industrial sources; and biodiesel production. When aggregated, the top five food waste feedstocks accepted by ADs in the U.S. in 2019 in order were: Fats, oils and greases (FOG); food processing industry waste; beverage processing industry waste; fruit/vegetative waste; and pre and postconsumer foodservice waste. Table 1 summarizes some key data collected.
Other highlights include:
- Digester Types: Majority of the digester types are wet and mesophilic systems, similar to the previous two surveys.
- Food Waste Preprocessing: Top preprocessing activity for stand-alone digesters is grinding and/or maceration. The top preprocessing activity for codigestion facilities at WRRFs is screening and/or sorting, and at on-farm codigesters, manual or mechanized depackaging.
- Biogas Production: Based on the data reported by 104 survey respondents, the total amount of biogas produced by all three digester types in 2017 was 25,274 standard cubic feet per minute (SCFM) — equal to 79 MW of installed capacity, or 588 million kWh/year of electricity generated. In 2018, totals were 27,193 SCFM — equal to 85 MW of installed capacity, or 633 million kWh/year of electricity generated.