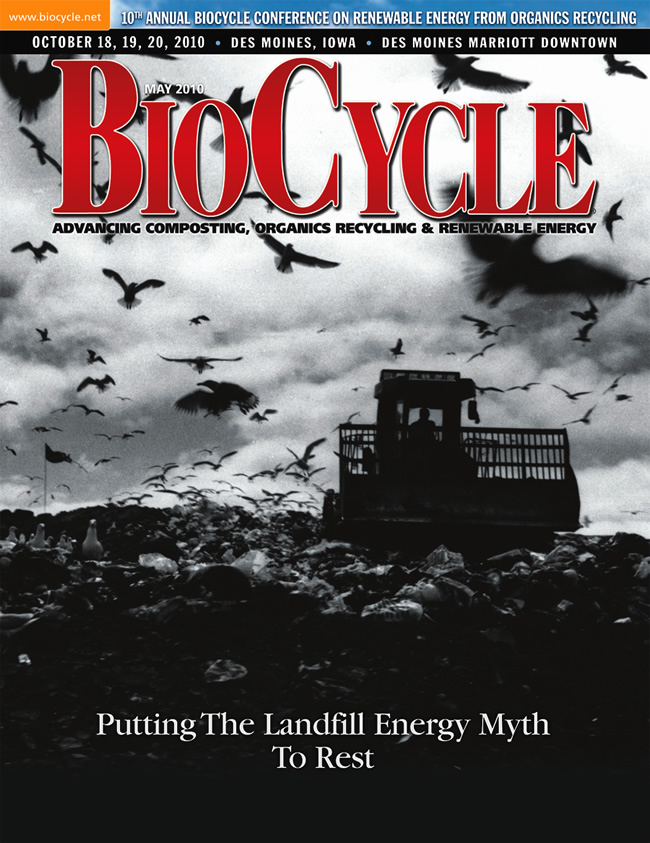
BioCycle May 2010, Vol. 51, No. 5, p. 23
Science and nature, as well as common sense, prove that “single-use” organics management via landfilling is a misuse of national resources.
Sally Brown
This article references figures and tables available in PDF version.
 THE purpose of a landfill is to dispose of waste, plain and simple. That is the story. People have had landfills of some sort or another since there have been people and there has been waste. Landfills are where you put stuff when you want it to go away, when you no longer have any use for it. When I was young, I never thought about landfills except when we took the Belt Parkway to visit my relatives in Brooklyn. The big landfill was on the left, with the Starrett City apartment buildings on the right. Now that I work with organics and climate change, not a day goes by that I don’t think about landfills.
Landfills are becoming a topic of more general discussion because of what goes into them and what happens to the stuff once it is there. This is part of a larger process of questioning the value of what we have traditionally considered to be waste materials and understanding the implications of different management strategies for these materials. As part of this process, the scientific community, politicians, businesses and the general public are hearing mixed messages on what are good things to do with waste materials.
Part of the reason that these messages are mixed is that we are at the beginning of a process to understand how to manage materials in a carbon-based economy where resources are limited. We are coming into this process as a culture that has always had landfills and a waste industry that has effectively and profitably managed them. Our rules and regulations for managing waste materials have focused on public health. Requirements to manage materials are centered on the goal of minimizing the potential for any negative impacts upon that public health. Now we have to consider waste materials using multiple lenses, including greenhouse gas emissions, demand for renewable energy and a growing scarcity of natural resources.
This new focus has led to a reexamination of the benefits/detriments of traditional waste management. Landfills have become more than a place to dispose of waste. Depending on one’s perspective, landfills are now generally viewed as: 1) A place to produce green energy and sequester carbon or 2) An inappropriate way to dispose of resources and a source of greenhouse gases. It is likely that neither perspective is completely correct or completely off base.
In order to understand whether landfilling is a viable way to manage residuals it is important to understand what the residuals are, the potential benefits associated with these materials and how to best realize these benefits. It is also important to understand how landfills function and, relative to that understanding, what conditions exist within and at the surface of a landfill. The focus of this discussion will be on the organic components of solid waste. For cans and bottles, an excellent discussion of benefits associated with recycling is provided at US EPA WARM (http://www.epa.gov/climatechange/wycd/waste/calculators/Warm_home.html).
WASTE CHARACTERIZATION
Waste characterization studies have been conducted to figure out what type of organics actually go into landfills. Waste going to a landfill will vary based on location, season and available diversion programs. The US EPA WARM model provides a breakdown of different components of MSW (municipal solid waste) by percent weight. Table 1 provides generation and disposal numbers for the components (organic fractions) discussed in this special report.
It is best to look at these numbers as gross approximations. For areas where yard trimmings are accepted into landfills, this number is likely to be significantly higher. The number will also be higher in places with long growing seasons. In areas with successful yard trimmings diversion programs, food scraps and soiled paper are likely to make up a significantly larger fraction of MSW. For example, a waste characterization study done in California found a higher food waste content (14.6%) and a low leaves and grass content (4.2%) (Cascadia Consulting Group, 2004). The Washington State Department of Ecology in cooperation with Washington State University completed a statewide biomass inventory (Frear et al., 2005). Inventories for King and Yakima counties are shown in Table 2. King County is the most urban county in the state, and Yakima is a primarily rural county with large dairy and tree-fruit industries.
ORGANIC MATERIALS CHARACTERISTICS
Now that you have some idea of what the different components of organic waste are, the next step is to describe in greater detail the characteristics of these materials.
Food wastes are generally wet materials. A ballpark moisture content for food scraps is 70 to 80 percent. The amount of soiled paper included in the food scraps will influence the moisture content as paper tends to be dry. Things like spoiled lettuce on the other hand, are very wet. One way to characterize food waste is to use the U.S. Department of Agriculture (USDA) food pyramid, which divides foods into the following categories: Grains; Vegetables, dry beans and peas; Fruits; Milk group; Meat and bean group; Oils; Solid fats and sugars. The chemical composition of a range of foods is also available from the USDA (http://www.nal.usda.gov/fnic/foodcomp/search/). The basic chemical content of select examples from each of the food pyramid groups is shown in Table 3.
Food scraps generally have high energy values (just look at that Almond Joy), and food scraps from a balanced diet will have high nutrient value (see the protein content). This is why, after all, we eat food in the first place. Different studies have characterized food waste from different sources in Korea, Germany and India. Moisture content in these studies varies from 74 to 90 percent, the ratio of volatile solids/total solids ranges from 80 to 97 percent and the C:N (carbon to nitrogen) ratio varies from 14.7 to 36.4 (Zhang et al., 2006). A study of source separated municipal organic waste from cities in Denmark tested the importance of dwelling type, season and collection system on waste composition (Hansen, et al., 2007). Fat and protein content were consistent across all parameters. The calorific value of the material ranged from 19.7 Mj/kg to 20.8 Mj/kg organic fraction of dry matter.
Yard trimmings vary in content by both season and location. In general, the wetter material in yard trimmings will also have the highest nutrient content. Take grass for example. A chemical analysis of rye grass is shown in Table 4. This is why ruminant animals like cows eat grass – it is good for them and low in fat.
Trees, wood and branches on the other hand are not so good as a food source. The chemical composition of wood will vary based on the type of tree, but wood generally consists of about 40 percent cellulose, 20 to 30 percent hemicellulose and 25 to 30 percent lignin. The energy value of wood is high, about 73 kcal per 100 g or 13 million BTUs/ton. The moisture content of wood will vary from > 50 percent for green wood to < 25 percent for older, seasoned or dead wood. Wood is hard to digest, with very high C:N ratios typically greater than 100:1 (and those splinters would wreak havoc on your intestines).
So this is the background you need to understand what is in these organics. The next step is to understand what they are good for (i.e., their value).
BENEFITS OF ORGANICS
Two components of organic residuals have value: the carbon content and the nutrient content. For this analysis, I am not considering the potential to utilize these organic residuals to make new products, e.g., making animal feed from food scraps and particleboard from wood waste.
The carbon content has value as an energy source and as fixed carbon. Remember that all of these organics we are talking about derive from plant material, with carbon taken from the atmosphere as CO2 and transformed into proteins, fats and lignin beginning with photosynthesis. This is the same starting point for fossil fuels and coal. Thousands and thousands of years ago, the oil that you put in your gas tank and the coal that makes electricity started out as leaves and branches from photosynthesis.
We are concerned about climate change because we have released more fixed carbon than we should have in balance with the annual natural process of plant growth, carbon fixation and decomposition. Without us interfering, this material would be part of the shorter-term carbon cycle, eaten by other creatures and turning back to CO2 to be fixed through photosynthesis for the next time around. We can use this carbon for energy and so reduce our dependency on fossil and coal reserves, or we can attempt to keep this carbon fixed and sequestered. That is the simple version. In an ideal world, we can do both: get energy from the carbon and use the remaining material to sequester carbon and even fix more through enhanced plant growth.
Nutrients in the organic residuals have value for plants and animals. These mineral nutrients (here meaning not carbon-based) are required by all living beings. Plants get them from soil and we get them from plants. The nutrients in these residuals can potentially be separated from the carbon and recycled. However, with our current level of technology, we can only use these nutrients by applying the residuals to soils where the nutrients will become available for plant uptake.
The nutrient-rich organics, including food scraps and nonwoody yard trimmings, will contain a well-balanced set of nutrients. These nutrients are important to recycle for several reasons; the two big ones are nitrogen (N) and phosphorus (P). Nitrogen, although plentiful in the atmosphere, is energy intensive to convert to a mineral form. Phosphorus, required by plants and animals in large quantities, is normally derived from phosphate rock, and our reserves of phosphate rock are due to run out in the near future. Before we mined phosphorus from rocks, the biggest commercial source was from bird poop or guano. There would have to be a lot of birds out there to meet current demands for this nutrient.
TAPPING THE ENERGY BENEFITS
So what have we learned so far? A wide range of organic residuals exist, and they vary based on energy content, nutrient content and water content. These variables also tell us the best things to do with these materials. The energy content (normally expressed in BTUs) is related to the carbon content. The best way to capture this energy is based on the moisture content of the materials. The nutrient content gives an indication of the value of the material as a fertilizer. Approximate BTU, moisture and nutrient contents of the different residuals being discussed in this report are listed in Table 5.
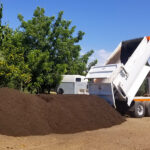
So here you are, looking at that pile of organics and starting to salivate because of the BTU value. You are seeing a mountain of green energy instead of food scraps, oily pizza boxes and wood. Three ways that you can turn that pile of organics into renewable energy are:
• Combustion
• Anaerobic digestion
• Pyrolysis/gasification
Combustion
Combustion is an alternate term for burning stuff. Standard combustion reactions require oxygen and convert carbon bonds in the organic material to heat energy. Combustion reactions do not take place if there is too much moisture in the substrate. Any moisture in the organics has to be evaporated prior to or during the combustion reaction. Water has a high specific heat, meaning that a lot of energy is required to transform the water into steam. In plain and simple terms, it is not energy efficient to burn wet stuff. If you use high moisture materials in combustion reactions, a large portion of the energy in the feedstocks is spent evaporating the water.
Combustion is a chemical reaction. Carbon bonds are broken, releasing carbon as CO2. Other elements also will be transformed to gases during combustion. Any nitrogen in the feedstocks will be lost as nitrogen gases during combustion. Elements that won’t volatilize will be left as ash residue. The percent ash will vary based on the feedstock but can range from 10 to 30 percent of the dry weight of the original material. The feedstock may have value as a soil amendment. Phosphorus won’t volatilize, so the ash will contain all of the phosphorus that was in the feedstocks.
Trace elements such as calcium, cadmium, zinc and lead can also be concentrated in the ash. If concentrations of some of these are high enough (lead and cadmium, for example) the ash may be considered a hazardous waste. Other elements, like zinc and calcium, are necessary plant nutrients, so the ash may have value as a fertilizer.
Combustion reactions also produce emissions. These emissions include particulates and can also include nitrogen oxides (NOx) and sulfur oxides (SOx). Burning high sulfur coal was the source of acid rain before regulations required emissions controls to limit release of NOx and SOx from these facilities. Nitrous oxide can also be released from combustion reactions that include high nitrogen substrates.
Bottom Line: Combustion is the most efficient way to generate energy from dry feedstocks with low nutrient content.
Anaerobic Digestion
Anaerobic digestion is a microbially mediated transformation of fixed carbon compounds to methane (CH4) and CO2 that takes place in the absence of oxygen. This is a biological reaction, the goal of which is to provide energy for the microorganisms. The methane produced through anaerobic digestion is also known as biogas or natural gas. When landfills make energy from methane, they do this via anaerobic digestion. Anaerobic digestion is less efficient and much more finicky than aerobic digestion (how we eat). This occurs in three stages: hydrolysis, fermentation and methanogenisis.
Each of these reactions has its own by-products and feedback loops. Hydrolysis reactions are chemical transformations of compounds that involve water and are carried out by extra-cellular enzymes. Fermentation reactions transform the products of hydrolysis reactions to fatty acids, alcohols, ammonia, acetate and hydrogen gas. Methane is produced during methanogenisis in one of three ways: Hydrogen gas can be oxidized (the oxidation is the energy source in the reaction) with the electrons from this reaction transferred to CO2 to produce water and CH4; acetate can be degraded into CO2 and CH4; and, finally, methyl groups are removed from methyl-bearing compounds and released as CH4 with the released electrons transferred to hydrogen gas.
A wide variety of organics can be used as feedstocks for anaerobic digestion. A partial list of potential feedstocks is shown in Table 6 (Totzke, 2009). Studies have been conducted to determine the maximum CH4 generation potential of these different feedstocks. The volatile solids (VS) content of each substrate is often used as a means to predict the maximum methane that can be generated by anaerobic digestion (Davidsson et al., 2007; Hansen et al., 2004). To determine volatile solids, you heat the substrate for a fixed amount of time at a fixed temperature. All organic carbon that can transform from solids to gas during this process is defined as the volatile solids (VS).
While VS defines the maximum amount of methane that can be generated from a substrate, measured methane concentrations from anaerobic digestion often fall below the predicted maxima. Hansen et al. (2004) used lab-scale digesters to measure CH4 generation from different components of household food scraps; paper bags were included. Substrates for this study were blended in a high-speed blender, mixed with water to reach a solids content of about 10 percent and added to thermophilic reactors (55°C) along with microbial inoculum from an operating biogas plant. Methane was measured over a 50-day period with most of the gas released within the first 12 days. The reactors were stirred, but no attempt was made to adjust the environment in the reactors to maximize CH4 production during the incubation. Results from the incubation are shown in Figure 1.

The authors suggest that the difference between optimal (theoretical) and observed CH4 generation likely were related to negative feedback loops for each of the substrates. For fats, for example, accumulation of volatile fatty acids likely reduced the pH to below acceptable conditions for the methanogens in one of the reactors. For protein, excess ammonia buildup likely halted the reactions. Decomposition of paper bags was also below predicted values. Other studies have suggested that the transformation of cellulose to sugars during hydrolysis is the rate-limiting reaction for high-cellulose materials such as paper bags and pizza boxes.
Many of these negative feedback loops can be controlled and adjusted to optimize gas production in dedicated digesters. For example, new digester designs include separating the fermentation reactions from the methanogen reactions to help control substrate pH. Research is being conducted to determine what microbes are able to digest what substrates and the best ways to keep these bugs “fat and happy.” It is known that digestion works best at temperatures between 33°C to 55°C. Digestion can be carried out in both wet (solids content < 10%) and dry (solids content < 25%) facilities. Adding appropriate microbial inocula, maintaining temperatures and pH and adjusting organics loading rates also appear to be key factors for maximum energy production. A well-run digester can achieve VS destruction efficiencies of close to 73 percent in the mesophilic temperature range and 80 percent in the thermophilic temperature range.
Anaerobic digestion also produces a solid residual in addition to CH4 and CO2. This residual will contain recalcitrant carbon compounds and a suite of nutrients. The nutrient content of materials coming out of wastewater digesters generally has 5 to 7 percent N and 2 to 3 percent P. This will be similar to materials from manure digesters and dedicated food waste digesters. Land application of residuals from anaerobic digesters is a well-studied practice. These soil amendments have been shown to increase plant yields, provide plant available nutrients, increase soil carbon reserves, improve soil tilth (structure) and increase soil water-holding capacity (Cogger et al., 1999; Cogger et al., 2001; Evanylo, 2003; Khaleel et al., 1981; Lindsey and Logan, 1998; Sukkariyah et al., 2005, Wallace et al., 2009).
Bottom Line: Anaerobic digestion is the best way to extract energy from wet feedstocks (Matteson and Jenkins, 2007). It is also a very good technology to derive energy from organics while conserving nutrients and a portion of the carbon for returning to the soil.
Pyrolysis/Gasification
Pyrolysis and gasification are two versions of a similar process. They have been receiving a lot of attention recently as an alternative means to treat organic residuals. Pyrolysis is a type of combustion reaction that takes place under conditions of limited oxygen and elevated pressure. This type of combustion produces three end products: char, a solid high-carbon material commonly known as charcoal; syngas, a synthetic gas rich in volatile carbon compounds that can be used for combustion and “synfuel”; and a liquid material also rich in carbon compounds that can be burned for energy.
The conditions in a pyrolysis reaction can be managed to optimize production of one of the three end products resulting in higher production of char, syngas or liquid fuel. Substrates for pyrolysis need to have low moisture content. Material should also be processed prior to the reaction to have similar particle size. Pyrolysis is a great concept because of the potential to produce three end products, each with an associated end use and value. It can be viewed as more of a transformation reaction that produces materials that can then be used for energy production. Drawbacks are the requirements for low-moisture substrates, homogenous feedstocks and high energy requirements to generate the three end products.
Bottom Line: Making syngas uses a substantial fraction of the energy contained in the substrates. If high net energy is your goal, pyrolysis is not the process for you.
THE FIXED CARBON VALUE
Energy is not the only value of the fixed carbon in organic residuals. This is carbon taken out of the atmosphere. If this fixed carbon had stayed in the atmosphere, it would be floating around as CO2. Each ton of carbon in the soil would make up 3.6 tons of CO2 in the atmosphere. The whole goal of the Kyoto Protocol and our attempts to reduce carbon emissions are to keep carbon in a fixed form rather than releasing it back into the atmosphere. So your pile of organic residuals also presents an opportunity to do just that: keep it fixed here at or below the surface rather than releasing it as CO2.
There are two ways to do this: 1) Bury the carbon in a tomb so it won’t decompose; or 2) Add it to soils to enrich soil carbon reserves. The answer you are going to get here is from a chef turned soil scientist, so realize that my view on the best approach may carry some personal prejudice and bias.
First you have to realize how carbon cycles. Basically, carbon is stored on the earth in several different pools. The largest is the oceanic pool with 38,000 Pg of carbon (Pg = petagram = 1 3 1015 g = 1 billion metric tons), followed by the geologic pool (comprised of fossil fuel) containing 5,000 Pg (4,000 Pg of coal, 500 Pg of oil, and 500 Pg of gas), the soil/pedologic pool containing 2,300 Pg to 1-meter depth (comprised of 1,550 Pg of soil organic carbon (SOC) and 750 Pg of soil inorganic carbon or (SIC)), the atmospheric pool containing 760 Pg, and, finally, the biotic pool containing 600 Pg of live mass and detritus material (Batjes & Sombroek 1997). Figure 2 is an illustration of the carbon cycle, using information from various studies to generate the values. It is helpful as a visual aid when reading the next few paragraphs.
")
Carbon exchanges between each of these different pools occur at different rates. The geologic pool, for example, lived in isolation with only very small deposits from the atmospheric pool until we got into the picture. The biotic and soil pools, on the other hand, exchange carbon with the atmosphere all of the time. Ten percent of atmospheric carbon passes through terrestrial ecosystems each year – just like a cup of sugar between neighbors. This is almost ten times the addition rate from fossil-fuel burning (Raich and Potter, 1995). Mean residence time (MRT) for carbon in soils is generally in the range of 20 to 30 years (Lal, et al., 1995; Post et al. 1992). If we tilt this balance just a little bit, leaving more of the carbon stored in soils and plants, we can make a major dent in atmospheric carbon concentrations. This is a very good thing. This is the best, easiest and cheapest way we know to sequester carbon.
It is important to realize that while a majority of the CO2 in the atmosphere is from the fossil pool, a very significant minority is from the terrestrial pool. Activities like urbanization, deforestation and large-scale industrialized agriculture have depleted these soil carbon reserves. Our soils contain much less organic matter than they used to. The potential soil C sink is close to historic soil organic carbon losses, about 55 to 78 Pg (Lal 2004), which is approximately 7.3 to 10.3 percent of the current estimated atmospheric pool. This means that our soils would drink up added carbon. The fact that we have depleted this pool over time means that soils have the potential to be a large carbon sink. They are well below equilibrium carbon concentrations, and so much of the carbon that is added to them (assuming good management practices) will stay there.
For example, a graduate student and I recently surveyed a wide range of soils from farms, turf grass, highway right of way and mine sites. All of these soils had been amended with biosolids or composts anywhere from two to 30 years prior to our sampling. In the healthy soils (no-till turf grass in an area of high rainfall), each ton of compost yielded 0.01 to 0.06 tons of added carbon to the soil. In more disturbed soils (e.g., mine sites, tilled farms), each ton of amendment yielded 0.2 to 0.5 tons of stored soil carbon. Considering that the carbon content of these amendments is about 30 to 40 percent, that is a pretty good return.
A primary focus of carbon sequestration is to keep the carbon under lock and key so that it has no potential to interact with the atmospheric pool and revert back to CO2. One example of this is deep-well injection of liquid CO2 a few miles into the earth. This type of project is being funded by the Department of Energy using carbon from coal-fired power plants. The wells are very expensive to drill, and where you put them is also a concern. It is not clear if the carbon that is injected will stay down below or gradually filter up into the atmosphere.
Landfill proponents argue that a portion of the organics that are landfilled will effectively remain under lock and key. The landfill that I talked about way back in the beginning of this report is now under a Target Store so maybe that carbon is under lock and key with an English bull terrier standing guard on top.
This type of carbon storage accomplishes one thing and one thing only – it stores carbon. I would argue that this is a short-sighted approach. When carbon is added to soil systems, a whole range of additional benefits occur. Some of these were mentioned briefly in the discussion of anaerobic digestion. These principles are also generally well recognized by people who have used organic soil amendments such as composts and biosolids. This is such a critical part of the discussion that I’m going to provide a little more information.
Organic amendments can increase SOC concentrations by increasing organic matter inputs directly through application and indirectly by associated increases in net primary productivity. That means that plants grow better in soils with higher organic matter. Not only are there greater inputs to soil carbon with high organic matter soils, you get more food. This is a direct contradiction of the saying, “you can’t have your cake and eat it too,” but it really happens (Izaurralde et al., 2001).

Figures 3 and 4 contain some data to show how it works. This is data from biosolids applied to dryland wheat in eastern Washington State. Figure 3 shows wheat yield and Figure 4 shows changes in soil carbon over time. This is an area where moisture is generally the most limiting factor for plant growth. In years where there was enough rainfall, the plots with biosolids grew more wheat than the plots with N fertilizer or the controls. You can also see how the carbon in the soil that received biosolids has increased over time. The green highlights in Figure 3 indicate when fertilizers and biosolids were applied to the fields. I should also mention that when these plots were sampled in 2008, the soils that had received the high rate of biosolids held 10 percent more water than the control or fertilized soils. This can mean a lot when it only rains 12 inches a year or when you consider that 80 percent of the water used in California is for crop irrigation.
You can get organic soil amendments from organic residuals in two ways – direct application (generally done after composting) or application of materials after anaerobic digestion. In both cases you conserve the majority of the nutrients in the materials. In both cases you conserve a portion of the carbon in the materials. In both cases you get increased soil carbon, improved soil properties and increased plant yield. And with anaerobic digestion, you get some of the energy benefits, too.
So now you know all about residuals and energy, residuals and carbon sequestration and residuals and nutrient conservation. Now it is time to talk about landfills. Finally you say, I’ve been reading this nonsense for page after page, just waiting to hear about landfills. Well, here goes.
SANITARY LANDFILLS
The United States has some of the best-managed landfills in the world. Legislation has required that modern landfills be constructed as sanitary landfills. That means waste is put into a lined cell, compacted and covered. Gas collection systems are mandated in these sanitary landfills if the landfill is big enough. Approximately 66 percent of the landfilled waste in the U.S. is disposed in landfills with gas collection systems (Sullivan, 2010). Collection systems are put into place as the landfill is constructed and begin operation from between one to five years from the time waste is first put into a cell. This collection continues for the active life of the landfill and for a period of time after closure. When you close a landfill you have to put a final cover over the surface. This is several feet thick and is designed to stop gases from escaping from the surface.
In the whole debate on where organics belong and whether landfills are environmental allies or enemies, you see a range of values for landfill gas capture efficiencies and a range of values for how much carbon is stored in a landfill. The U.S. EPA had traditionally set landfill gas capture efficiency at 75 percent across the lifespan of the landfill. This value is in the process of being changed to reflect varying collection efficiencies during the different stages of the life of a landfill.
The Solid Waste Industry for Climate Solutions issued values for collection efficiencies at these different stages (SWICS, 2009):
• 50 to 70 percent for the part of a landfill that is under daily cover and has an operating gas collection system;
• 55 to 95 percent for the part of the landfill that has an intermediate soil cover with an active gas collection system; and
• 90 to 99 percent for landfills under final cover with active gas collection systems.
Capture efficiencies are not provided for the periods when gas capture systems are not operating – those first few years during waste collection and the decades following the end of legal requirements for collection. However, one study reported that gas collection efficiencies were reduced by 79 percent when the gas collection system was not operating (Lohila et al., 2007). In other words, when the gas collection system isn’t operating (e.g., in the first 1-5 years that waste is put into a cell), the gas collection efficiency is pretty low.
Nitrous oxide (N2O) emissions also need to be considered. In a recent report on the importance of landfill gas collection, no mention is made of N2O emissions, although several studies have reported N2O emissions from the surface of sanitary landfills where gas collection systems are operating. Börjesson and Svensson (1997) measured N2O emissions from landfills in Sweden where soil or municipal biosolids were used for cover soil. Nitrous oxide emissions from the mineral soil ranged from -0.0017 to 1.07 mg N2O-N/m2/h. Emissions from the areas covered with biosolids ranged from -0.011 to 35.7 mg N2O-N/m2/h. Other studies have reported N2O emissions from landfills ranging from -0.102 to 6.0 mg N m-2h-1 (Rinne et al. 2005; Zhang et al., 2009).
These results, and there are plenty more that I haven’t mentioned, suggest that depending on where and when you measure, landfills likely emit both CH4 and N2O. The periods when these emissions (both CH4 and N2O) are highest are in the initial stages of waste deposition when no gas collection systems are operating. They are likely lowest, potentially near zero, when final cover is in place and gas collection is operational. Needless to say, emissions are also likely higher in landfills without gas collection systems – those landfills where 33 percent of our wastes are disposed. It is also likely that engineering solutions can be identified to further improve gas collection. It would likely be a challenge to install and operate piping systems in cells where waste is actively being deposited, but I am sure it can be done. This would likely add to the expense associated with managing landfills, which in turn would add to the cost of disposing of material in these landfills.
LANDFILLS AS ENERGY GENERATORS
The next question is how good are these landfills at making biogas? Remember that landfills make biogas via anaerobic digestion, that finicky process discussed earlier. The answer to that question depends on what it is like inside one of those sanitary cells. A few studies have measured conditions in a landfill cell. Their findings are shown in Table 7. Compared to dedicated anaerobic digesters, the temperature in the landfills studied seems pretty good, except for that small one. And methane formation, even in the colder landfill, seems to get going fairly quickly, within a few weeks to a few months.
In fact, a different study suggested that a minimum of 50 percent of the potential methane in landfill feedstocks can be generated within the first year of residence in a landfill (Themelis and Ulloa, 2007). However, conditions seem too dry for optimal gas generation. Remember that in dedicated digesters, dry digestion is defined as having a moisture content of 75 percent.
The same study that noted that much of the methane is likely produced during the first year of residence time in a landfill (Themelis and Ulloa, 2007) also reported CH4 capture rates in comparison to modeled rates of CH4 generation and found efficiencies ranging from 6 percent to 100 percent with a mean value of 35 percent. That means either much of the gas has gone missing or that it was never made in the first place. Three studies suggest that the latter hypothesis is correct, at least for certain of the feedstocks:
Sormunen et al. (2008) sampled wastes of different ages from two landfills in Finland. One landfill had been operating for 17 years and the other for 48 years. The younger landfill had a higher ratio of volatile solids:total solids (VS:TS). Biological CH4 potential (BMP) and the ratio of VS:TS was highest in the middle and top layers. The percent of wood was similar across all depths. The authors noted that the proportion of paper and cardboard was lowest at the bottom depth, indicating that these materials had decomposed. There was no detection of food-related residuals at any depth.
Ximenes et al. (2008) sampled landfills in Sydney, Australia and also found that wood products persist in a landfill environment. In this study, different types of wood from three landfills that had been closed for 19, 29 and 46 years were sampled. Moisture content of the wood ranged from 41.6 to 66.8 percent. The total carbon, cellulose, hemicellulose and lignin concentrations of specific wood types from the landfills were measured and compared to fresh samples of the same species. There was no evidence of decomposition in the two younger landfills. In the oldest landfill sampled (46 years), up to 18 percent of the original carbon content of the wood had decomposed.
Bäumler and Kögel-Knabner (2008) analyzed waste from a number of landfills in Germany for chemical composition. The authors found high concentrations of cellulose in waste material of different ages and interpreted this to mean that paper waste does not readily decompose in a landfill. (I’ve also heard anecdotally about a study in which a newspaper from 1974 was recovered from an Arizona landfill with the crossword puzzle still legible.)
These results suggest that for a majority of organic feedstocks (paper and woody materials), anaerobic degradation rates in landfills are very slow. Like gas capture, we can probably make them better if we want to. Morton Barlaz of North Carolina State University suggested that landfills managed as bioreactors with leachate recirculation will have much more efficient methane generation than those left to make gas on their own time. Data from a laboratory decomposition study where moisture and nutrients were added to all feedstocks was used to develop decay rates for waste materials in conventional and bioreactor landfills (Barlaz, personal communication). As you can see in Table 8, things go much faster when there is enough water around. It should be noted that the food waste used for this study consisted primarily of cellulose and lignin, stuff that we can’t digest. It appears that all that was left of the pizza used for this trial was the box.
Results of these various studies suggest that landfills do produce methane, some more than others. They also suggest that landfills release gases, some more than others and more at some stages than others. And they suggest that there are ways to make landfills generate more gas and ways to collect more of the gas that is generated.
Bottom Line: What these studies also suggest – and this is the most important detail – is that landfills are best suited as a place to throw stuff away rather than to optimize the carbon, energy and nutrient values of organics.
CONCLUSIONS – PLAIN AND SIMPLE
So what does this all mean? This means that landfills have done an excellent job of providing us with a place to dump stuff. As we understand the implications of dumping stuff, these landfills can be engineered to also release less CH4 and produce more biogas. If we want to continue to dump stuff, this might be an okay way to go (and I fully admit that there is some stuff that I am more than happy to dump).
However, we are entering a new era where resources are limited and carbon is king. In this new era, dumping stuff may cease to be an option, because that stuff has value and that value can be efficiently extracted for costs that are comparable to or lower than the costs – both environmental and monetary – associated with dumping. This can be done best at places that are constructed specifically to manage resources rather than places to dump waste. These are places like dedicated digesters, composting facilities and combustion facilities. However much you engineer a landfill, it will never be as efficient at making and capturing gas and energy as a dedicated digester or a combustion facility. That landfill may, through its inefficiencies, end up sequestering a portion of the carbon that is dumped in it. However, this carbon will never serve any valuable function, help to feed us or make plants grow better. All the nutrients trapped with the carbon will be sequestered too.
It is true that you can detect CH4 and N2O emissions from different composting operations, just like you can from landfills. But you can detect a whole lot more from poorly managed composting systems than from well-managed systems (Brown and Subler, 2007). For all that we do, we will have to learn how to do things to make the lowest imprint and to optimize our resources. You can’t separate the argument on landfill efficiencies from a real discussion on how we need to manage those resources. This means not throwing them away – and landfills are for throwing things away.
Sally Brown, PhD – Research Associate Professor at the University of Washington in Seattle – is a member of BioCycle’s Editorial Board and authors the monthly BioCycle column, Climate Change Connections. Dr. Brown can be contacted at slb@u.washington.edu.
References
Batjes, N.H., W.G. Sombroek. 1997. Possibilities for C sequestration in tropical and subtropical soils. Global Change Biology. 3: 161—173.
Bäumler, R. and I. Kögel-Knabner. 2008. Spectroscopic and wet chemical characterization of solid waste organic matter of different age in landfill sites, Southern Germany. J. Environ. Qual. 37:146-153.
Brown, S. and S. Subler. 2007. Composting And Greenhouse Gas Emissions: A Producer’s Perspective. BioCycle. 48:3:37-41.
Cascadia Consulting Group. 2004. Statewide waste characterization study. California Integrated Waste Management Board Publication # 340-04-005. www.ciwmb.ca.
gov/Publications/.
Cogger, C.G., D.M. Sullivan, A.I. Bary and S.C. Fransen. 1999. Nitrogen recovery from heat-dried and dewatered biosolids applied to forage grasses. J. Environ. Qual. 28(3):754-759.
Cogger, C.G., A.I. Bary, S.C. Fransen and D.M. Sullivan. 2001. Seven years of biosolids versus inorganic nitrogen applications to tall fescue. J. Environ. Qual. 30(6):2188-2194.
Evanylo, G.K. 2003. Effects of biosolids application timing and soil texture on nitrogen availability for corn. Comm. Soil Sci. Plant Analysis. 34:1:125-143.
Frear, C.B. Zhao, G. Fu, M. Richardson, S. Chen and M.R. Fuchs.2005 Biomass inventory and bioenergy assessment, an evaluation of organic material resources for bioenergy production in Washington State Washington Department of Ecology publication no. 05-07-047.
Hansen, T.L., J.E. Schmidt, I. Angelidaki, E. Marca and J. la Cour Jansen, H. Mosbaek and T.H. Christensen. 2004. Method for determination of methane potentials of solid organic waste. Waste Management. 24:393-400.
Hansen, T.L., J. la Cour Jansen, H. Spliid, Å. Davidsson and T.H. Christensen.2007. Composition of source-sorted municipal organic waste collected in Danish cities. Waste Management. 27:510-518.
Izaurralde, R.C., W.B. McGill, J.A. Robertson, N.G. Juma and J.J. Thurston. 2001. Carbon balance of the Breton classical plots over half a century. Soil Science Society of America Journal. 65:431-441.
Khaleel, R., K.R. Reddy and M R. Overcash. 1981. Changes in soil physical properties due to organic waste applications: a review. J. Environ. Qual. 10:133-141.
Lal, R., J. Kimble, E. Levine and C. Whitman. 1995. World soils and greenhouse effect: an overview. In: R. Lal, J.M. Kimble, E. Levine and B.A. Stewart (eds.), Soils and Global Change, Series: Advances in Soil Science, CRC Press LLC, Boca Raton, Fla. Pp. 1-7.
Lal, R. 2004. Soil carbon sequestration impacts on global climate change and food security. Science. 304: 1623-1627.
Lefebvre, X., S. Lanini and D. Houi. 2000. The role of aerobic activity on refuse temperature rise, I. Landfill experimental study. Waste Manage. Res. 18:444-452.
Lindsey, B.J. and T.S. Logan. 1998. Field response of soil physical properties to sewage sludge. J. Environ. Qual. 27:534-542.
Lohila, A., T. Laurila, J. P Tuovinen, M. Aurela, J. Hatakka, T. Thum, M. Pihlatie, J. Rinne and T. Vesala. 2007. Micrometeorological measurements of methane and carbon dioxide fluxes at a municipal landfill. Environ. Sci. Tech. 41:2717-2722.
Mähnert, P., M. Heiermann and B. Linke. 2005. Batch- and semi-continuous biogas production from different grass species. Ag. Eng. International CIGR Ejournal VII. Available at http://cigr-ejournal.tamu.edu/volume7.html (verified 5 Mar. 2008).
Matteson, G.C. and B.M. Jenkins. 2007. Food and processing residues in California: Resource assessment and potential for power generation. Bioresource Technology. 98:3098-3105.
Post, W.M., W.R. Emanuel and A.W. King. 1992. Soil organic matter dynamics and the global carbon cycle. In: World Inventory of Soil Emission Potentials (eds. Batjes, N.H. and Bridges, E.M.), pp. 107—119. WISE Report 3, International Soil Reference and Information Centre, Wageningen.
Raich, J.W. and C.S. Potter. 1995. Global patterns of carbon dioxide emissions from soils. Global Biogeochemical Cycles. 9:23-36.
Rinne, J., M. Pihlatie, A. Lohila, T. Thum, M. Aurela, J. Tuovinen, T. Laurila and T. Vesala. 2005. Nitrous oxide emissions from a municipal landfill. Environ. Sci. Tech. 39:7790-7793.
Sormunen, K.M. Ettala and J. Rintala. 2008a. Detailed internal characterization of two Finnish landfills by waste sampling. Waste Management. 28:151-163.
Sukkariyah, B.F., G. Evanylo, L. Zelazny and R.L. Chaney. 2005. Cadmium, copper, nickel, and zinc availability in a biosolids-amended Piedmont soil years after application. J. Environ. Qual. 34:2255-2262.
Sullivan, P. 2010. The importance of landfill gas capture and utilization in the U.S. SCS Engineers.
Themelis, N.J. and P.A. Ulloa. 2007. Methane generation in landfills. Renewable Energy. 32:1243-1257.
SWICS, 2009. Current MSW Industry Position and State-of-the-Practice on LFG Collection Efficiency, Methane Oxidation, and Carbon Sequestration in Landfills, SCS Engineers for SWICS.
Totzke, D. 2009. Tapping the potential of co-digestion. BioCycle. 50-6: 32-35.
USEPA. 2009. MSW in the U.S.: Facts and Figures. Aug 2009 – Vol. 25.
Wallace, B.M., M.Krzic, T.A. Forge, K. Broersma and R.F. Newman. 2009. Biosolids increase soil aggregation and protection of soil carbon five years after application on a crested wheatgrass pasture. J. Environ. Qual. 38:291-298.
Ximenes, F.A., W.D. Gardner and A.L. Cowie. 2008. The decomposition of wood products in landfills in Sydney, Australia. Waste Management. 28:2344-2354.
Zhang, R., H.M. El-Mashad, K. Hartman, F. Wang, G. Lui, C. Choate and P. Gamble. 2007. Characterization of food waste as a feedstock for anaerobic digestion. Bioresour. Technol. 98:929—935.
Zhang, H.P. He and L. Shao. 2009. N2O emissions at municipal solid waste landfill sites: Effects of CH4 emissions and cover soil. Atmospheric Environment. 43:2623-2631.
Zhao, X., R. Musleh, S. Maher, M.V. Khire, T.C. voice and S.A. Hashsham. 2008. Start-up performance of a full-scale bioreactor landfill cell under cold-climate conditions. Waste Management. 28:2623-2634.