Local governments around the country have adopted various regulations and incentives to reduce use of plastic bags. Research evaluates their effectiveness.
Megan E. McLaughlin and John M. Halstead
BioCycle August 2016

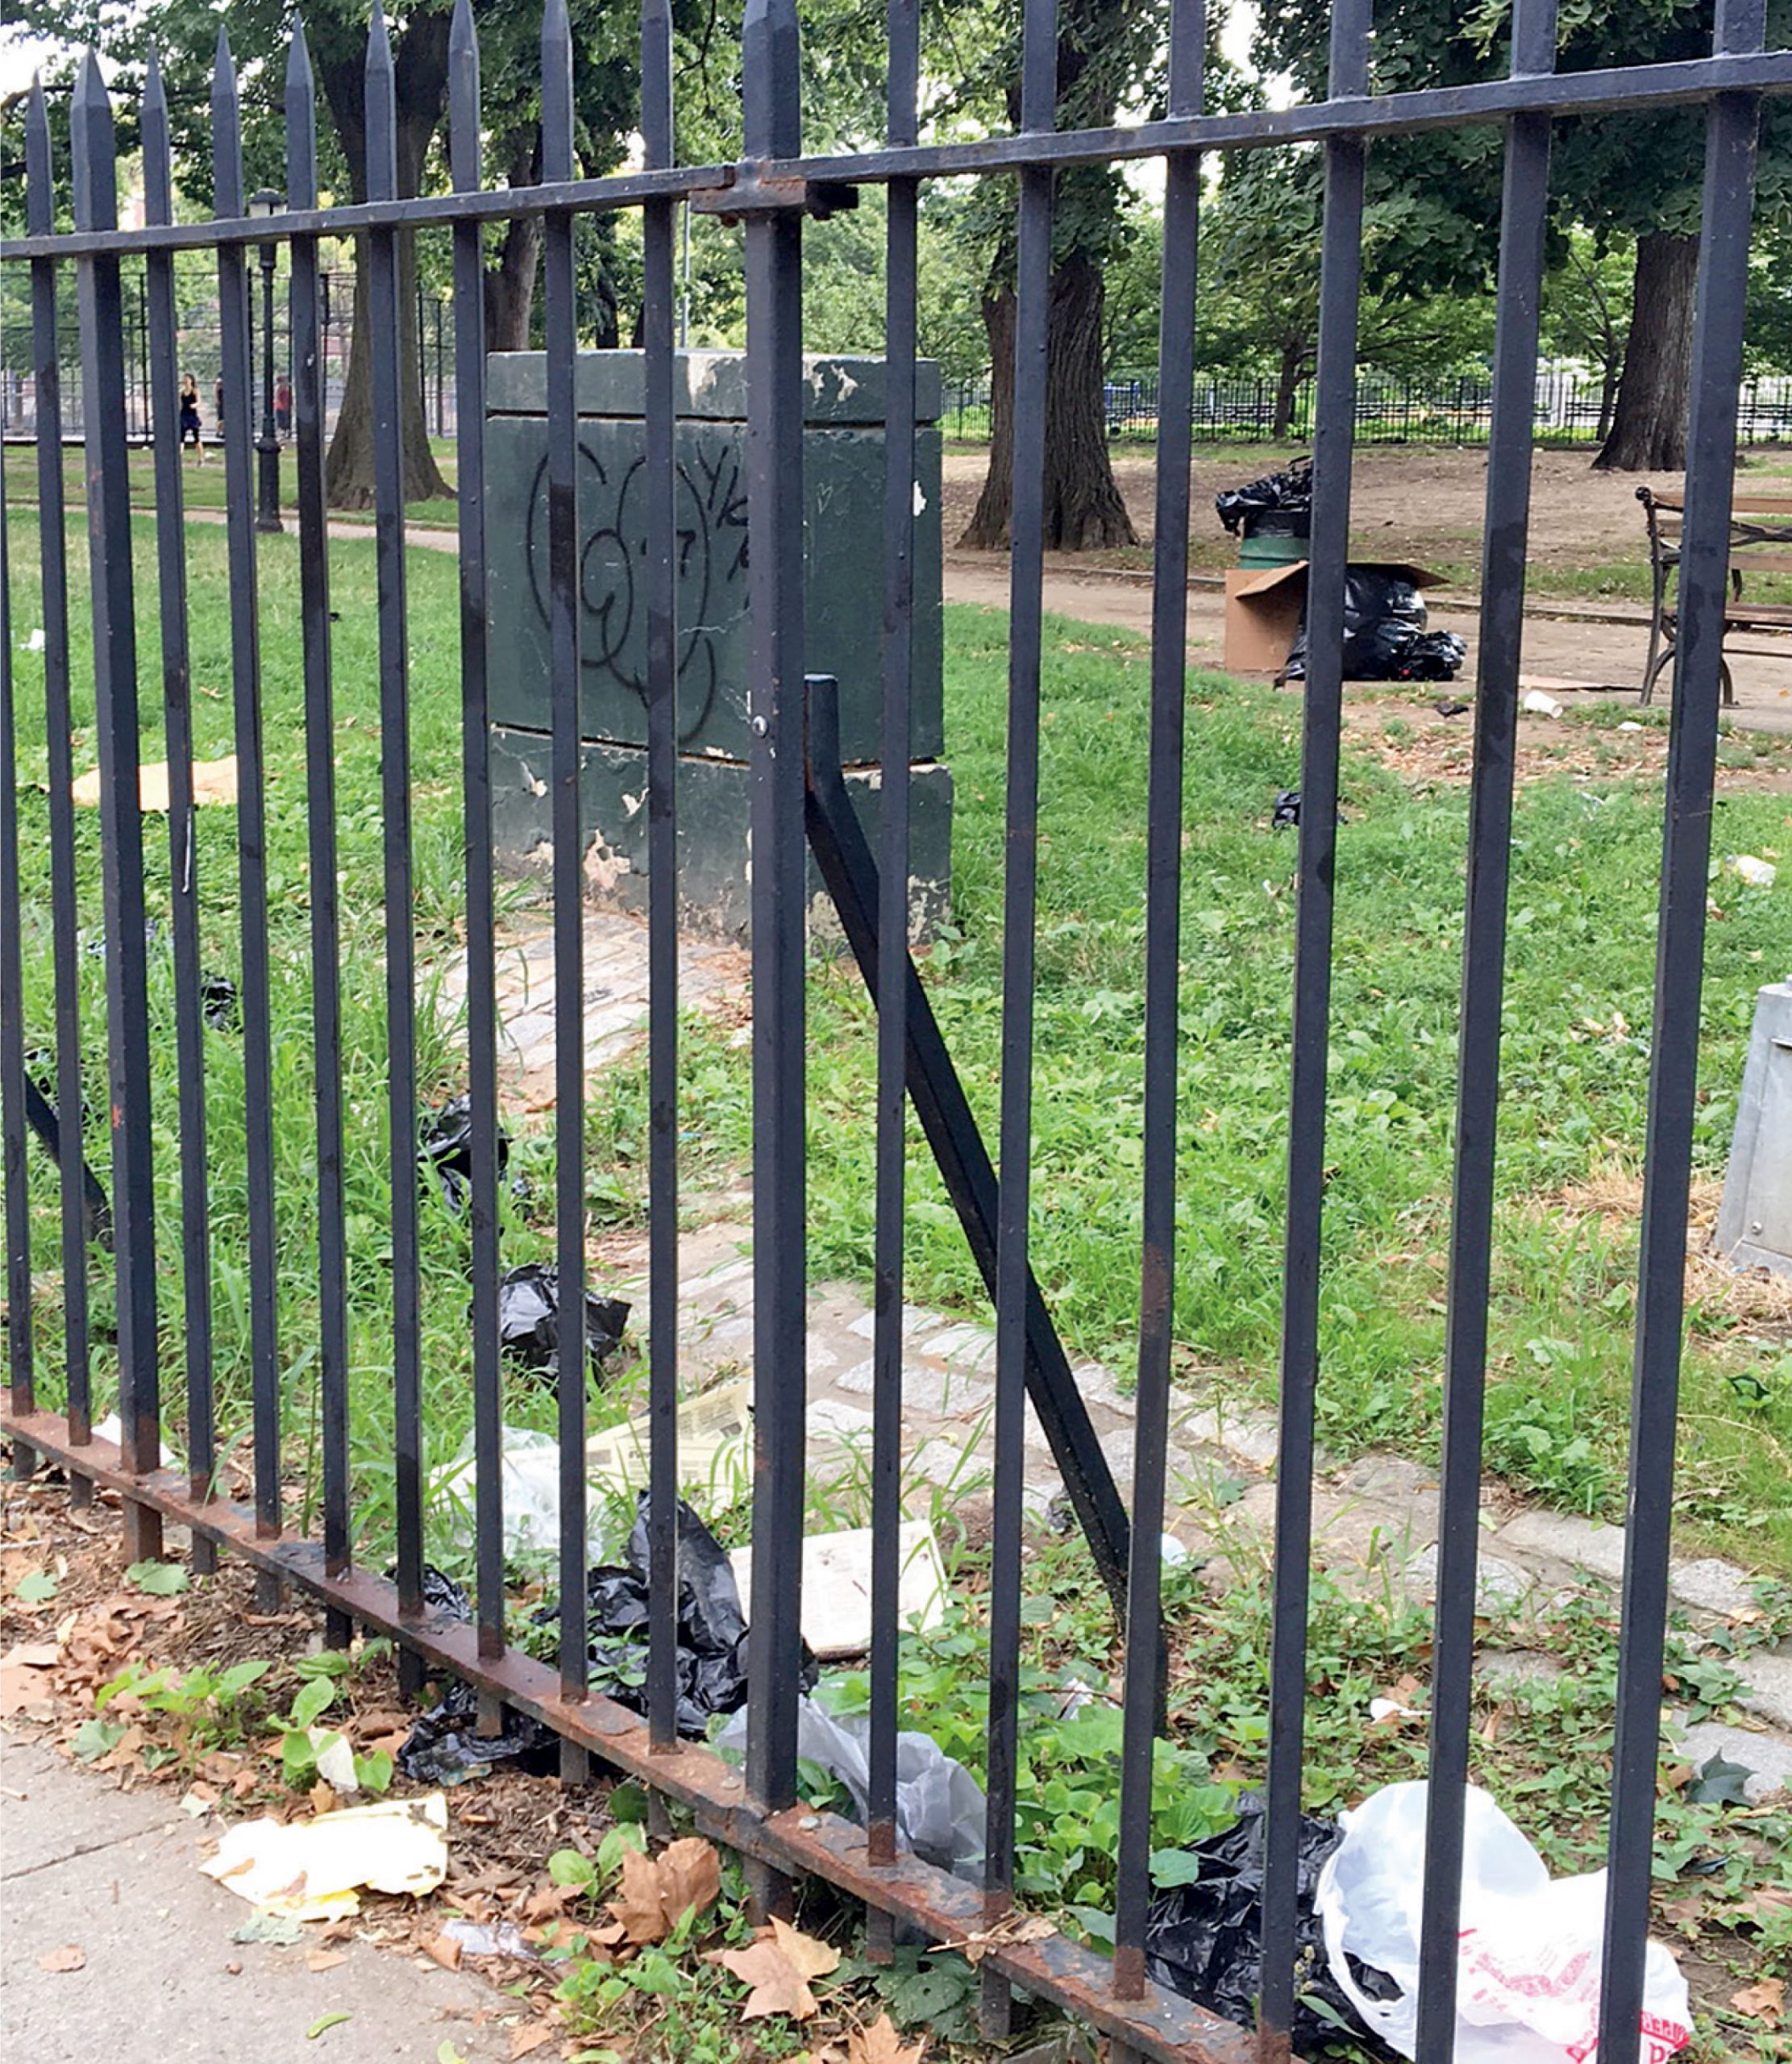
Photo by Hannah Clark
Each year, Americans consume over 100 billion single use plastic bags, the most ubiquitous of all throwaway items. Their usefulness can be measured in minutes; unfortunately, the waste lingers longer, and can clog sewer lines, create problems in recycling plants, and pollute waterways. However, single use plastic bags are also cost-effective and more durable in inclement weather.
Local, state, and national governments are trying to manage single use plastic bag waste, using bans, fees, improved recycling and compostable bags. Nongovernmental organizations and environmental activists are pressuring the government to reduce plastic bag consumption, promoting measures that industry and retail organizations sometimes oppose. Key questions raised include how plastic bags are being used, why they are being used, and most important, what do we do with them once they have been used?
Plastic Bag Policy Measures
When weighing the pros and cons of managing plastic bags, one option is an outright ban. Another is assessing a fee or tax on plastic bags; this can reduce single-use bag consumption while allowing customers to choose if they want a plastic bag. According to Romer and Tamminen (2014), charging for plastic bags has a greater impact on reduction because it incentivizes behavioral change and forces customers to make a conscious decision to purchase a bag. The last option is voluntary take-back/recycling programs to address plastic bags at the end of their useful cycle.
A research project was conducted to understand the effectiveness of bans, taxes and take-back/recycling programs. U.S. communities that have taken plastic bag action were studied, examining motivating factors, whether it was a local or state effort, and patterns between communities. Phone interviews were conducted with municipal representatives, and the researchers studied news articles and public opinion, and reviewed local legislation and revenue documents (McLaughlin, 2016).
Case studies from 13 locations were selected based on availability of information, supplemented by online data. The case studies fell into the three types of programs:
Bans: Austin, Texas; Portland, Oregon; State of Hawaii; Westport, Connecticut; Alameda County, California
Take-Back/Recycling: State of Delaware; State of Rhode Island; Phoenix, Arizona; Brooklyn, New York
Plastic Bag Taxes: Washington, D.C.; Portland, Maine; Breckenridge, Colorado; Montgomery County, Maryland.
Reasons for policy initiation included concern about environmental impacts, citizen welfare, impacts to waterways, litter, storm water infrastructure impairment, and the excessive use of plastic bags overall. For example, in Montgomery County, the watershed was so polluted with litter that it violated the Clean Water Act.
Regulation Effectiveness
Bans
The bans examined varied widely in implementation and detail. In Alameda County, the details of the regulation were explicit; however, in Austin, a reverse incentive occurred. Its ban exempted plastic bags that are 4 mil in thickness or greater with handles, as well as paper bags made of 40 percent recycled content with handles. Austin’s ban led to a reduction in plastic bags covered by the ordinance, but an increase in larger, ban-exempt 4 mil or greater plastic bags (Waters, 2015). In Portland, Oregon, reusable checkout bag use increased 304 percent while paper checkout bag use increased 491 percent (Bureau of Planning and Sustainability, 2012). The Westport, Connecticut’s conservation director noted, “businesses have adjusted well, consumers took to the ban with only a bit of early grumbling, and the amount of loose bag trash has definitely dropped” (Hladky, 2014).
Take Back/Recycling Programs
In Brooklyn, prior to implementation of a recycling program, plastic bags were getting stuck in recycling equipment. After the installation of ballistic separators — which act as a series of sieves and shakers to remove 2-dimensional materials from 3-dimensional containers — plastic bags can be recycled more easily. While some bags still get caught in the system, it is working well to handle the large amount of plastic bags that go along with the population density in the City (Green in Bklyn, n.d.).
In Delaware, all plastic bags must be labeled “Please Return This Bag to a Participating Store for Recycling” or similar language to encourage reuse and recycling; stores are required to offer reusable bags to consumers. The voluntary recycling program is not doing enough on its own and Delaware is considering imposing a fee on plastic bags, with revenue raised used to help stores fund their existing recycling programs (Willing, 2015). Rhode Island’s “ReStore” program was very well received and was initially voluntary for the consumer, and mandatory for commercial facilities to participate. Bags are taken back essentially everywhere in Rhode Island and the program is considered a success.
Phoenix partnered with the Arizona Food Marketing Alliance to encourage voluntary participation from its grocer members. Retailers still support the program eight years after implementation. The Public Works Department uses its quarterly Customer Service Survey to gather community input and determine education effectiveness. Plastic bag use at stores has dropped by 12 percent, 1,300 tons of plastic bags have been captured annually by six grocery store chains, and there was a 20 percent decline in plastic bags brought to the Materials Recovery Facility (MRF).
Taxes and Fees
Washington D.C. set a tax of 5 cents/plastic bag, which generated between $1.5 million to $2 million in each of the ordinance’s first four years. This revenue trend implies that the tax was not high enough to change behavior as individuals still chose to use bags and pay the fee. Similarly, in Montgomery County, which also has a 5 cents/bag tax, revenue generated in the first year of the tax was over $2 million as county shoppers have been more willing to pay for bags than anticipated. Officials projected a 60 percent decline in bag usage for the program’s first year, which was overly optimistic. Conversely, environmental groups that conduct cleanups of county stream banks reported a significant reduction in the number of bags recovered (Turque, 2013).
Revenues from bag fees are used for a variety of purposes. In Washington, D.C., one cent of each five cents fee is retained by the retail establishment, with the remainder kept by the Office of Tax and Revenue (DDOE, n.d.). According to a city audit, a majority of the money was allocated for school fieldtrips and employee salaries. One-third of spending and allocations from the fund has gone toward trash traps to clean the Anacostia River and other environmental initiatives (Brittain and Rich, 2015).
In Breckenridge, revenues are split between the town and retail businesses, which use their portion of the fee to help recoup program costs. Breckenridge uses fee revenue to purchase and distribute reusable bags and educate the public about the program. Merchants’ response to the fee was mixed but overall positive (Duboise, 2013). There was a 40 percent reduction in bags the first year, locals have shown exceptional support, and most tourists have been supportive. There has been pushback from some of the lodging companies as bags are distributed at no cost to visitors (Surfrider, 2015).
Discussion And Takeaways
Which policy measure is best to control plastic bags? Looking at the results and drawing comparisons between communities, bans on plastic bags have the potential to work, but may offer loopholes that harm the environment. For instance, in Austin and Honolulu, banning plastic bags of certain thicknesses resulted in higher usage of heavier plastic bags, which found their way into the waste stream. On the other hand, Portland, Oregon found a 300 percent increase in reusable bag use, Westport saw the amount of loose bag trash drop, and reusable bag sales increased in Alameda County. Stricter regulations regarding bag thickness could result in less plastic entering the waste stream, and result in higher use of reusable bags.
Take-back programs had similar mixed results. On the whole, the take-back program in Delaware was ineffective, as plastic bags still littered waterways, but Rhode Island saw great progress reducing plastic bag waste. In Phoenix, plastic bag use dropped 12 percent at stores, with a 20 percent decrease in plastic bags entering the MRF. In Brooklyn, enforcement of local laws helped decrease plastic bag usage. A key component of these programs is outreach; more effort to get competing retail, grocery and pharmaceutical chains on board helps increase recycling habits by the consumer as these businesses are major distributers of plastic bags.
Taxes had a mostly desired effect on plastic bag usage. Revenue from the tax has been allocated towards environmental and other social issues. Overall, revenue has not declined significantly, so some consumers are still opting to pay the tax. In Portland, Maine, reusable bag sales are up 350 percent at one major grocery chain. Other Maine cities are moving towards plastic bag legislation as a result. In Breckenridge, a 40 percent reduction in bags was seen the first year.
Clearly, each policy measure has advantages and disadvantages, and it is impossible to broadly generalize from the researchers’ small set of case studies. When banning plastic bags, communities studied found that paper bags should be taxed or banned as well to prevent consumers from switching to this alternative, which has a larger carbon footprint (Ketcham, n.d.). A tax on bags needs to be set high enough that consumers will change their behavior. A take-back/recycling program needs to be accompanied with an education program to make it a habit for consumers.
Megan E. McLauglin is an Assistant Town Planner in Old Orchard Beach, Maine. This research was conducted as part of her graduate study. John M. Halstead is Professor of Environmental and Resource Economics at University of New Hampshire. Partial funding for this research was provided by the New Hampshire Agricultural Experiment Station. This is Scientific Contribution Number 2680. This work was supported by the USDA National Institute of Food and Agriculture Hatch Project 0233237.