New report compares performance of seven biogas management technologies, focusing on economics and emissions.
C. Ely, R. Williams, T. Martynowicz and M. Kosusko
BioCycle October 2016
This fall, the U.S. Environmental Protection Agency (EPA) will publish Evaluating the Air Quality, Climate & Economic Impacts of Biogas Management Technologies. A collaboration led by the University of California Davis Biomass Collaborative, the report presents the efficiency, cost of energy, and criteria pollutant and greenhouse gas emissions (GHG) associated with seven biogas management technologies. Those technologies include: combustion in a reciprocating engine; combustion in a gas turbine; combustion in a microturbine; conversion in a fuel cell; processing for pipeline injection; processing to create renewable Compressed Natural Gas (CNG); and flaring.
The research focused on California because the state has unique air quality challenges that complicate compliance with National Ambient Air Quality Standards (NAAQS). However, with strengthening of NAAQS for ground level-ozone, challenges unique to California could become more commonplace. As air quality regulators across the country consider limits on stationary sources, insights from the proverbial “canary in the coal mine” may prove instructive.
Many California biogas operations are located in ozone nonattainment areas (i.e., an area considered to have air quality worse than the NAAQS), where air districts are working to reduce stationary source emissions, especially from reciprocating engines. While required to upgrade energy systems to meet more stringent emission limits, many organic waste managers, project owners and regulators alike lack sufficient information about the overall performance of available biogas management technologies.
A more complete understanding of the environmental and economic performance of biogas-to-energy technologies will assist state and local governments, regulators, and potential project developers in identifying geographically appropriate and cost-effective biogas management options. Evaluating the Air Quality, Climate & Economic Impacts of Biogas Management Technologies attempts to advance that understanding.
Research Scope And Methods
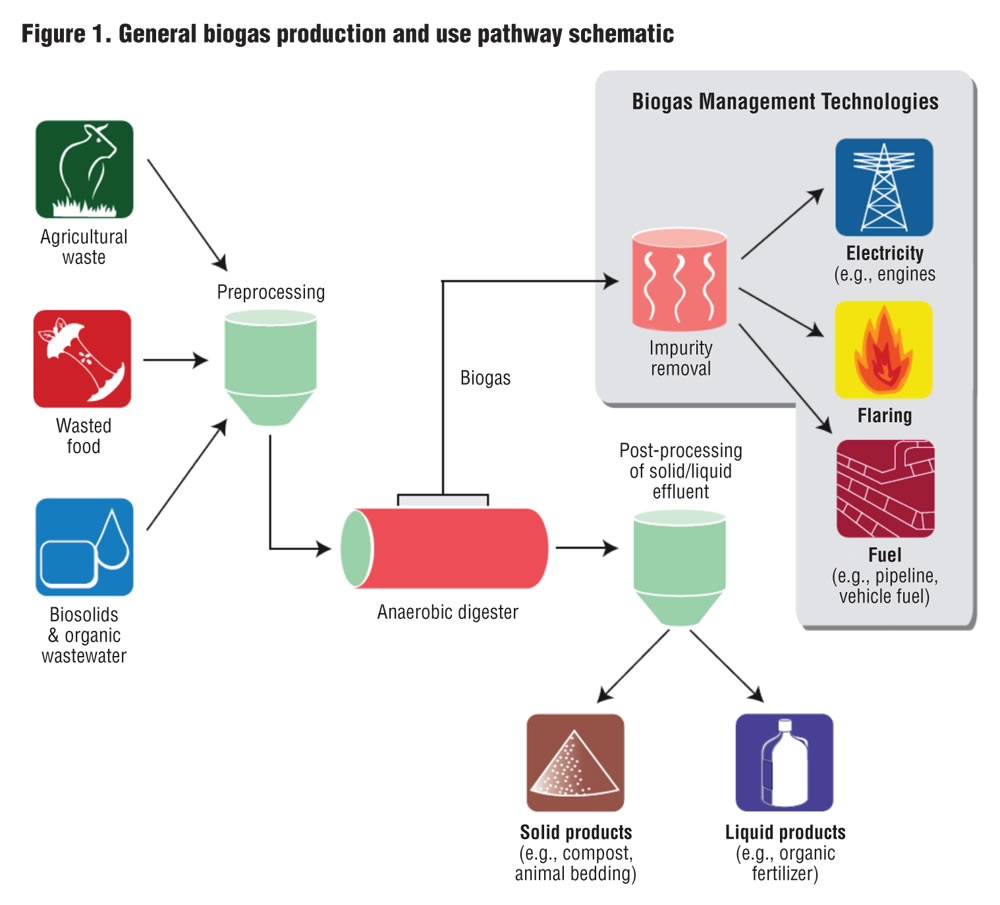
The boundary of this analysis encompassed the on-site use (conversion or upgrading) of already produced biogas. Upstream (e.g., the vehicle fuel consumed to transport material to the biogas facility) and downstream (e.g., the carbon temporarily sequestered by land applying biosolids) sources and sinks are beyond the scope of this study. Correspondingly, capital, operations and maintenance costs pertaining to biogas management were evaluated, including those for biogas pretreatment and exhaust gas treatment. Costs associated with producing raw biogas were excluded, such as building a digester or managing feedstocks. As indicated by the shaded box within Figure 1, our analysis focused on the biogas management stage.
The following properties and characteristics were evaluated and compared:
• Conversion efficiency: percent energy efficiency for electricity production systems, higher heating value basis (i.e., electrical energy output / biogas energy input) and percent yield for compressed renewable natural gas (RNG) and pipeline injection processes.
• Levelized cost of energy (LCOE): dollar per kilowatt hour ($/kWh), dollar per million British thermal units ($/MMBtu) or $/gasoline gallon equivalent ($/GGE).
• On-site criteria pollutant and GHG emissions.
Source information included peer-reviewed and “gray” literature, operating permits, source test reports and expert and developer interviews.
Cost Comparison
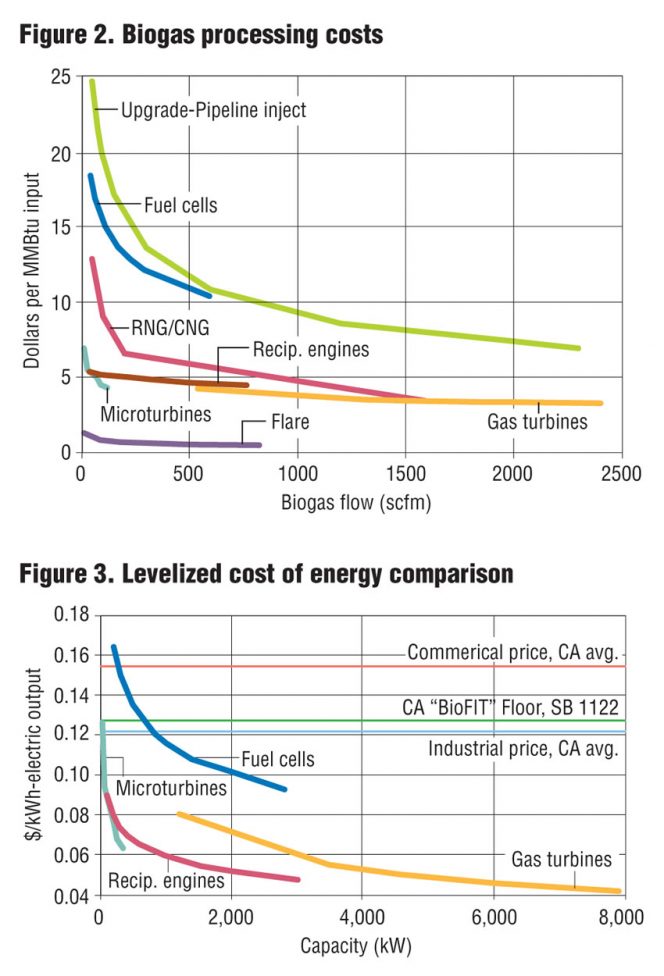
Flaring appeared to be the lowest cost biogas management option at less than $1/ MMBtu (input flow basis). However, unlike the other technologies evaluated, flaring produces no energy product that could return value, reducing project costs. Options, in order of increasing cost, were:
• Gas turbines, with costs ranging from $3.25 to $4.20/MMBtu
• Reciprocating engines, with costs ranging from $4.40 to $5.35/MMBtu
• Microturbines, with costs ranging from $4.30 to $6.85/MMBtu
• Upgrading and converting to CNG, with costs ranging from $3.40 to $12.80/MMBtu
• Fuel cells, with costs ranging from $10.40 to $18.40/MMBtu
• Upgrading the biogas for pipeline injection, with costs ranging from $7 to $25/MMBtu
There are economies of scale for all of the processes investigated with fuel cells, microturbines and pipeline injection showing strong economies of scale (Figure 2).
The LCOE for fuel cells ranged from ~$0.16 per kWh at a small size (200 kW) to about $0.09/kWh at the 3 MW size. The LCOE for reciprocating engines varied from $0.09 to $0.05/kWh for 100 kW to 3 MW capacity, respectively. For microturbines, LCOE ranged from $0.13 to $0.06 $/kWh for 30 kW to 333 kW, respectively. Combustion turbines (gas turbines) had the lowest LCOE of about $0.04/kWh at large scale (8 MW).
Managing biogas using microturbines, reciprocating engines, and gas turbines appeared to compete with industrial and commercial electricity prices in California, which ranged from $0.12-$0.16/kWh in 2015. The cost of those technologies also appeared to fall below the California Bioenergy Market Adjusting Tariff floor of $0.127/kWh (feed-in tariff power purchase agreements for eligible bioenergy projects per an amendment (SB 1122) to the CA Public Utilities Commission code).
Regarding the renewable CNG pathway, the fuel production cost ranged from $0.50/GGE for the 1600 Standard cubic feet per minute (SCFM) system to $2.40/GGE for the 50 SCFM system. These costs are lower than current California fuel prices and the $2.51/gallon average of the last 20 years.
Again, these energy production costs reflect those for managing biogas (Figure 1). They do not include costs for producing raw biogas. Furthermore, those factors that would offset projects costs, such as energy savings, subsidies, tipping fees or the sale of coproducts, were not analyzed.
Emission Comparison
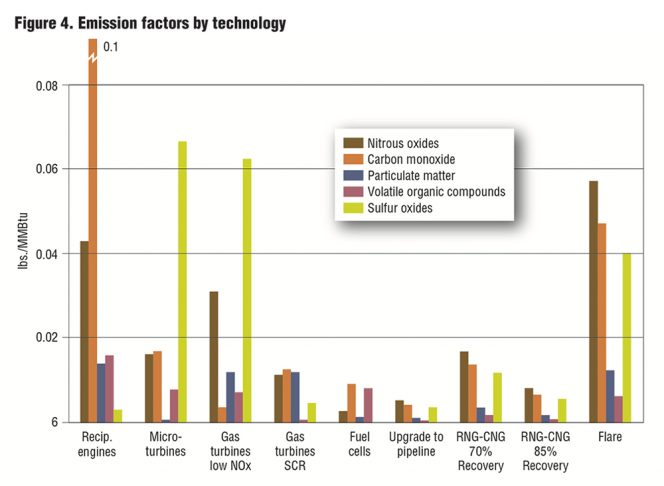
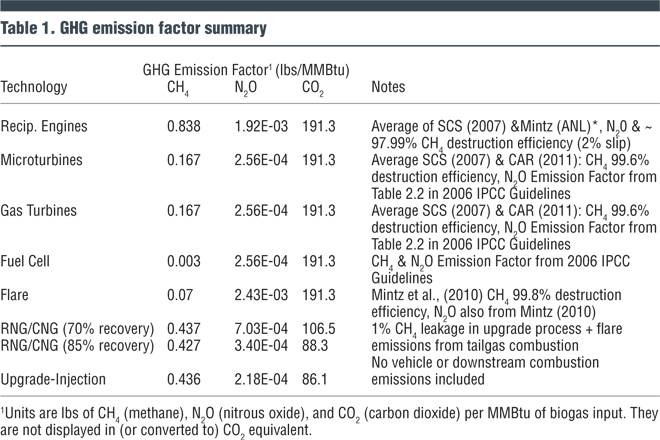
In order of decreasing nitrous oxide (NOx) emissions (as lbs/MMBtu gas input), flares were the highest followed by reciprocating engines (meeting 11 ppm emission standard per South Coast Air Quality Management District (SCAQMD) Rule 1110.2); low-NOx gas turbines; CNG systems with 70 percent methane recovery (for RNG-CNG fuel upgrade systems, the tail gas is assumed to be flared); microturbines; gas turbines with selective catalytic reduction; CNG systems with 85 percent recovery; pipeline injection; and fuel cells (Figure 4). The emissions factors for the other criteria pollutants analyzed did not all follow that same sequence.For GHG emissions, all biogas management options emit small, but significant, amounts of methane as “slip” from conversion devices or through leaks in processing equipment. Methane emissions ranged from about 0.003 to 0.838 lbs per MMBtu (Table 1). The largest component of the GHG emissions profile was biogenic carbon dioxide (i.e., emissions related to the natural carbon cycle, as well as those resulting from production, harvest, combustion, digestion, fermentation, decomposition, or processing of biologically based materials). These emissions ranged from about 88 to 191 lbs per MMBtu of biogas input. On-site CO2 emissions include those originally in the input biogas and those produced through combustion of methane in the conversion device.
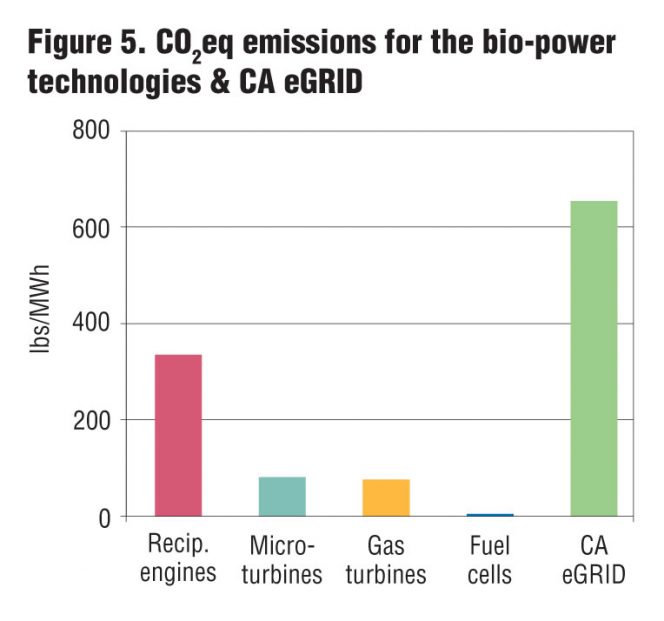
The CO2 equivalent (CO2eq) emission factors for biogas-fueled microturbines, gas turbines, reciprocating engines, and fuel cells were considerably lower than the average California electric grid carbon footprint, which is 653 lbs CO2eq per MWh, according to the U.S. EPA’s eGRID (Figure 5). Consistent with eGRID, we did not include biogenic CO2 emissions to calculate CO2eq emissions. (The Emissions & Generation Resource Integrated Database (eGRID) is a comprehensive source of data on the environmental characteristics of almost all electric power generated in the United States.)
As acknowledged, the scope of this study is limited — it is not a full system or life cycle emissions accounting. Only emissions associated with managing biogas were analyzed (Figure 1). Upstream and downstream emissions and sinks were not considered.
Other Costs, Revenues And Policies
Recognizing the limited scope of the analysis and the important role of additional factors in evaluating a project’s economic and environmental performance, the report includes a qualitative description of possible additional costs — such as acquiring a natural gas powered fleet for the CNG pathway — and possible sources of revenue, e.g., savings from on-site energy use or income from off-site energy sales. The report also includes a compendium of grants and other financial incentives.In general, evaluating impacts is no easy task. One approach can at once hinder and advance societal goals. Diverting organics from landfills and into digesters limits rogue methane emissions, reducing short-lived climate pollutants. Yet, combusting biogas in stationary engines can exacerbate local air quality problems. Digestate-based fertilizer products build healthier soils, sequestering carbon and increasing agricultural water efficiency. Yet, in some California counties, the land application of biosolids is effectively banned. The less money a water resource recovery facility (WRRF) spends on energy, the more it can invest in upgrades such as tertiary treatment, helping to expand local water supply during drought. Yet, emission limits on stationary engines increase operating costs, restraining WRRF budgets.
Some of these conflicts may be real, others perceived. Balancing state goals with local ordinances and industry preferences to advance the projects and policies with the greatest net environmental benefit is a tall order. Future biogas research could help lead the way by considering broader upstream and downstream impacts as they pertain to cross-media goals. How and at what cost can biogas projects realize clean energy, clean air, clean water, healthy soil and waste diversion goals?
A first task could be to identify how to economically reduce criteria emissions (Figure 4) from stationary engines over a time period agreeable both to regulated facilities and local air districts. If after-gas treatment technologies (e.g., SCR) on reciprocating engines are an acceptable interim solution, how is that achieved and what comes afterward? Our analysis and the 2014 SCAQMD assessment of after-gas cleanup technologies are first steps. What additional research, legislative action or funding solution will be next?
Our report provides a side-by-side comparison, showing the environmental and economic performance of seven different biogas applications in California. While not exhaustive, it provides a bare bones synopsis. By doing so, a generic baseline now exists, a metric that can be used to measure progress. Shrinking costs and emissions reductions can be used to indicate the efficacy of related technological and policy innovations. How these metrics change over the next 20 years will be telling.
Charlotte Ely, a Life Scientist, works for the Sustainable Water Infrastructure program with U.S. EPA in Region 9. Rob Williams is a Research Engineer with the Dept. of Biological and Agricultural Engineering, University of California, Davis. Trina Martynowicz is in the Clean Energy and Climate Change Office at U.S. EPA Region 9. Mike Kosusko is a Chemical Engineer with U.S. EPA’s Office of Research and Development. For a copy of the report, e-mail Rob Williams at rbwilliams@ucdavis.edu.
Correction, January 9, 2017:
The vertical axis of Figure 4 was erroneously labeled “$/kWh-electric output”


