Top: Reinford Farms in Mifflintown (PA) anaerobically digests various food waste streams with dairy manure. Photo courtesy Reinford Farms
Nora Goldstein
In 2014, EPA began building a dataset of names and locations of anaerobic digestion facilities processing food waste to better understand the practice and prevalence of food waste digestion in the U.S. In December 2016, EPA was granted the authority to survey digesters annually, and EPA renewed that authority until 2025. The data presented below are from the sixth and final round of data collection, which was completed in 2024; data for 2022 and 2023 were collected. This is the final set of survey data — released in early October — that will be published, according to the agency. This article is a summary of the most recent findings, excerpted from the 2024 report.
Three types of anaerobic digestion facilities were surveyed:
- Stand-alone food waste digesters: The primary feedstock processed is food waste. Two types are defined by EPA — those accepting and processing feedstocks from one or more sources for a tipping fee and those built to process industry specific wastes (common in the food and beverage industry). The latter are co-located at processing plants and are designed to process a certain kind of material. These units typically do not accept other feedstocks from offsite sources.
- On-farm digesters that codigest food waste: Dairy, swine and poultry are the primary animal types for farms with digesters. On-farm manure digesters can also accept outside food waste as a feedstock. The most common digester system technologies on farms in the United States are plug flow, complete mix, and covered lagoons. The type of digester used on farms is typically determined by the manure management practices in place and type of animal manure that is fed into the digester.
- Digesters at water resource recovery facilities (WRRFs) that codigest food waste: The primary purpose of anaerobic digesters at WRRFs is to treat wastewater solids. Adding food waste streams to a WRRF digester boosts biogas production without utilizing much of a digester’s capacity. The digesters vary in a number of ways including processing rate, number of stages to the process, operating temperature, extent of pre-digestion processing and the types of mixing strategies.
Generate Upcycle’s Cayuga Digester in Auburn, New York is an example of a stand-alone food waste AD facility. Photo courtesy Generate Upcycle
Survey Methodology
The 2024 survey was provided to 313 facilities believed to be operational and for which EPA had contact information. The 313 facilities included 96 stand-alone digesters, 89 on-farm codigestion operations, and 128 codigestion systems at WRRFs. EPA also kept the link to the survey open on the Anaerobic Digestion website through August 5, 2024. EPA received responses from 65 operational and two non-operational facilities across 29 states. The two non-operational facilities were in the construction stage, or temporarily shut down at the time of the survey. Not all facilities responded to all questions. All data were voluntarily submitted by survey respondents and were aggregated and checked for quality before publication.
The following data were collected: Amount of food waste processed; amount of non-food waste processed; feedstock types and sources; amount of biogas produced; and information about tipping fees. Other data collected reflect circumstances at the time of the survey, including operational dates and operational status, operational specifications, biogas use, and digestate treatment and use.
Food Waste Processing
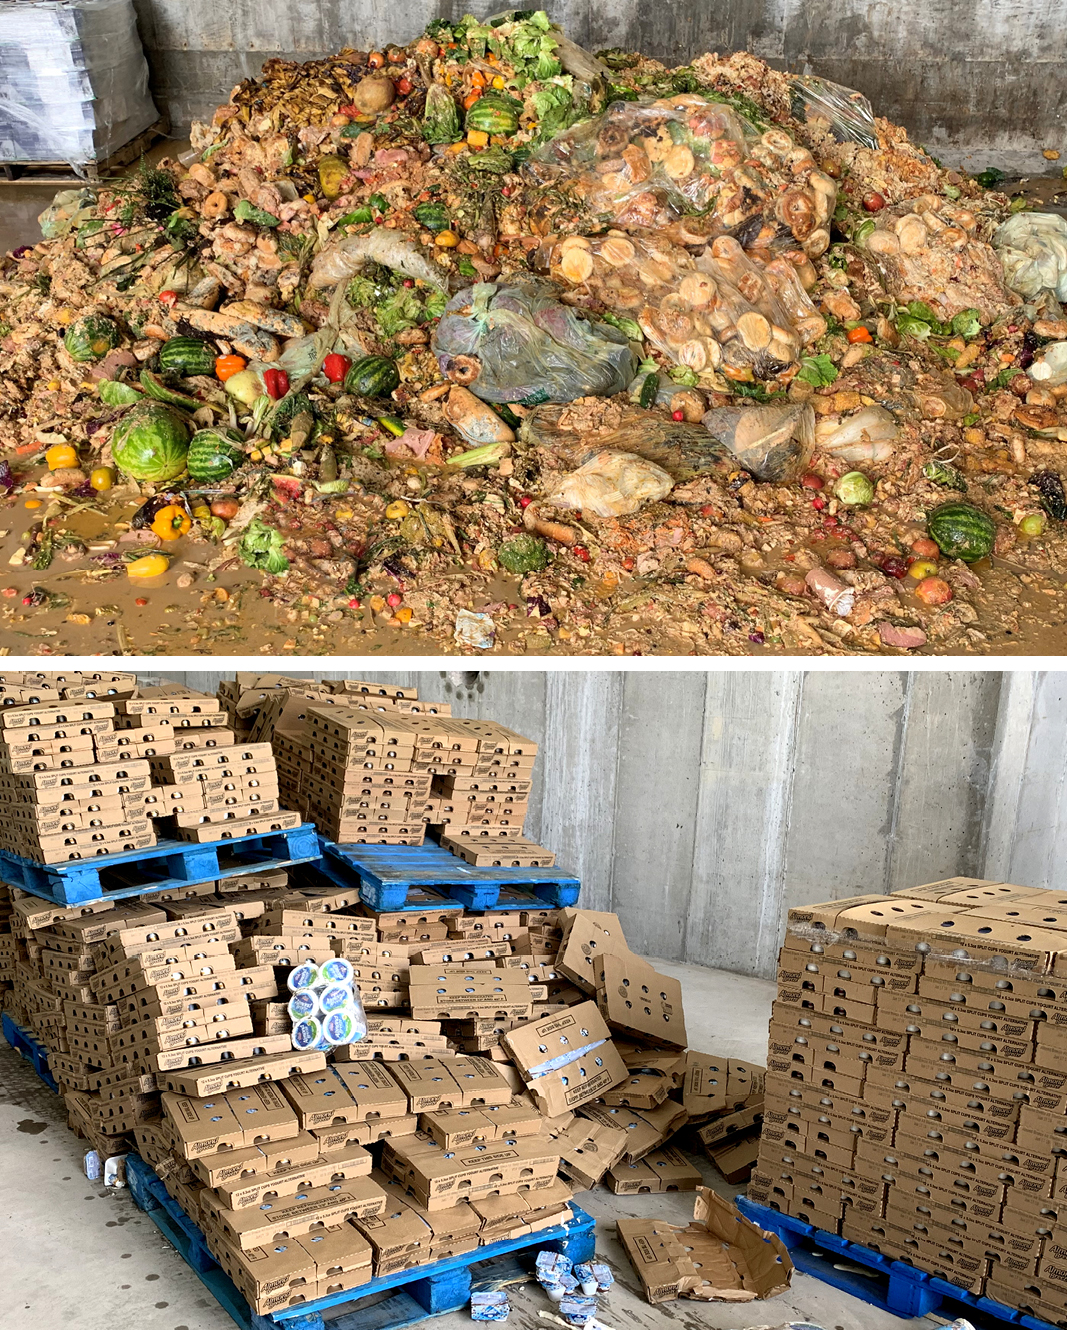
Commercial organics received at the Oneida-Herkimer Solid Waste Authority’s (OHSWA) preprocessing facility include loads of food waste from supermarkets (top) and packaged goods from food manufacturers (above). Food waste is digested at the Oneida County (NY) WRRF. Photos courtesy of OHSWA
Of the 65 facilities that were operational at the time of survey, five did not process food waste in 2022 and 2023. For the purposes of the survey, sources of food waste streams include the following categories: Beverage processing (e.g., liquid wastes from brewing beer); fats, oils and greases or FOG (e.g., used cooking oils); food processing; foodservice, pre and postconsumer (e.g., kitchen scraps or uneaten plate waste); fruits/vegetative; retail (e.g., unsold food from grocery stores); slaughterhouse; source separated commercial, institutional or residential organics; and other food waste.
In both 2022 and 2023, the top five sources of food waste processed via anaerobic digestion were as follows (in order of most to least tons):
- Industrial — manufacturing and processing
- Commercial — food retail/wholesale
- Commercial — restaurants and foodservices
- Other — a combination of commercial, residential, institutional, and industrial that could not be disaggregated by the facility
- Industrial (other)
Industrial sources were reported in significantly larger quantities than other sources. Manufacturing and processing accounted for over 14 million tons, and 6 million tons in 2022 and 2023, respectively. The commercial sector was reported as processing over 400,000 tons (retail and wholesale, both 2022 and 2023), and 200,000 tons (restaurants and foodservice, both 2022 and 2023). The two other sources listed, other and industrial (other), reported between 40,000 and 90,000 tons of processing for the data years. Outside the top five sources there was a significant decrease in reported tonnages with all other sources reporting less than 200 tons.
In 2022 and 2023, the top six types of food waste processed were as follows (in order of most to least tons):
- Beverage processing industry
- Food processing industry in 2022; FOG in 2023
- FOG in 2022; food processing industry in 2023
- Source separated commercial, institutional or residential organics
- Process and/or wash water
- Foodservice, pre and postconsumer
Where facilities reported their food waste processing amounts in gallons, EPA used conversion factors appropriate for each feedstock to convert gallons to tonnages before calculating the total amount of food waste processed each year. For example, beverage processing industry waste was assigned the density of water (8.34 lb/gallon), higher than the density of source separated organics and other similar food wastes (3.8 lb/gallon). Accordingly, a volume (in gallons) of beverage waste converts to a greater tonnage than the same volume of source separated organics.
Based on data submitted by 56 survey respondents, and EPA’s conversions where necessary, the total amount of food waste processed in all three digester types in 2022 was over 16 million tons. In 2023, 58 respondents processed over 7.6 million tons of food waste. The difference in reported totals is largely attributable to the amounts of waste from the beverage industry that were processed in 2022 and 2023.
Beverage processing waste at stand-alone digesters comprised the majority of food waste processed in 2022 and 2023. This is consistent with previous years of survey data, and is due to several factors, the first being its density is similar to water, as noted above. Second, most anaerobic digesters in the U.S. are wet systems, designed to process high-moisture feedstocks, such as process water, wash water, and other liquids that contain organic solids. Finally, nearly half of the stand-alone facilities responding to the 2024 survey are co-located at breweries and solely dedicated to processing brewery waste. In 2023, these stand-alone digesters reported processing less than half of their processing totals from 2022, resulting in the unexpected decrease in total processing. The use of anaerobic digestion systems at breweries is well-established.
Table 1 shows the amounts of food waste processed in 2022 and 2023 with and without beverage processing waste included, for comparison. Tonnages are wet U.S. tons.

Tip Fees, Biogas, Digestate
The compilation and analysis of data collected in 2022 and 2023 includes findings on tipping fees, biogas production and use, and solid and liquid digestate uses.
Tipping Fees
Of 60 respondents, 80% reported collecting tipping fees; 18 facilities shared data on tipping fees collected in 2022 and 2023. Based on those responses, in 2022 the median tipping fee for all incoming feedstocks was $20.63/ton and the average was $30.27/ton. In 2023, the median tipping fee was $22.23/ton and the average was $32.27/ton. Four facilities reported setting base rates of $0.01, $0.06, $0.09, and $0.10 per gallon of feedstock. Several facilities charge different rates depending on the quality, type, or source of feedstock. For example, the facility might set fees higher if food waste needs to be depackaged, they might charge grease haulers but not source separated food waste haulers, or they may charge to tip food waste but not manure.
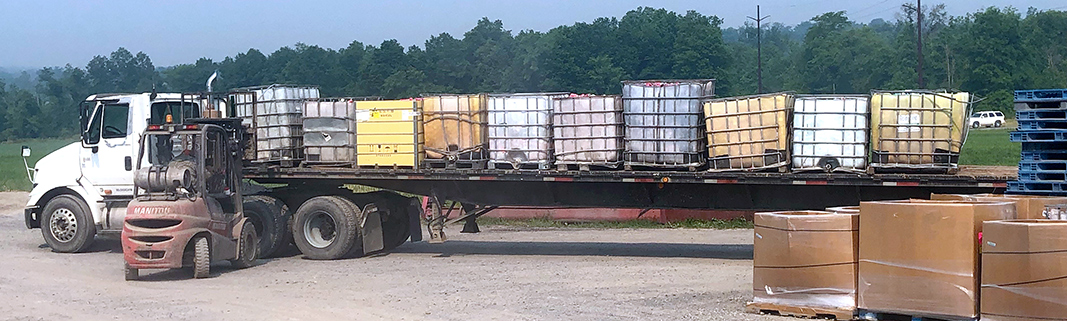
IBC totes of liquid food waste hauled in by Reinford Farms. Photo by Nora Goldstein
Biogas Production and Use
Based on the data reported, the combined total amount of biogas produced from food waste and non-food feedstocks by respondents of all digester types was 18,926 standard cubic feet per minute (SCFM) in 2022 and 19,711 SCFM in 2023. Fifty respondents provided usable data for 2022 and 53 for 2023. Of 55 responding facilities, 84% reported using a gas cleaning system at the time of survey. The most common constituents removed were hydrogen sulfide, sulfur, and moisture.
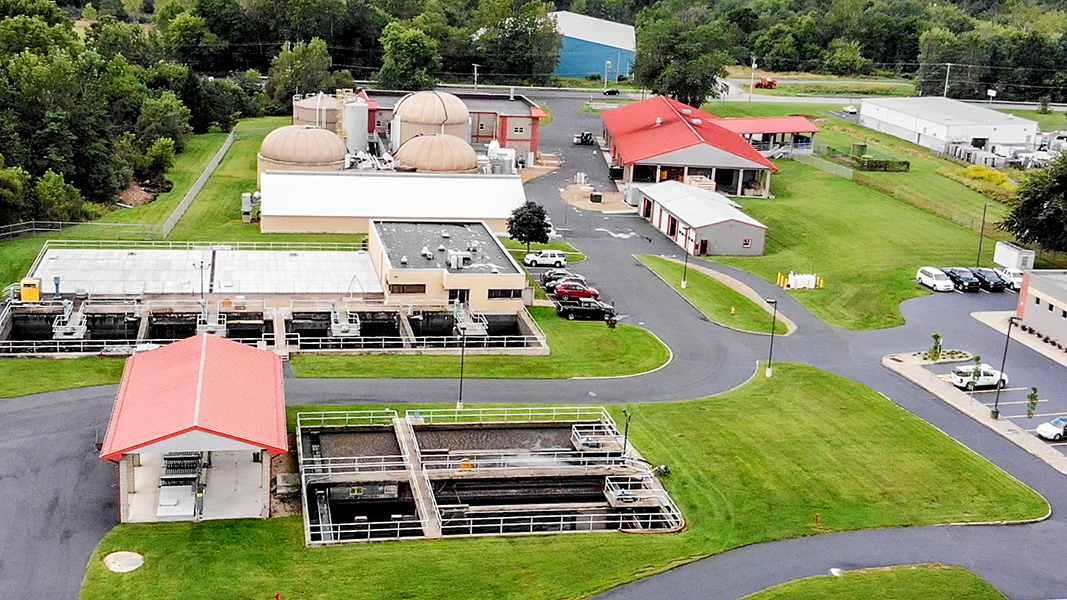
The footprint of the Hermitage (PA) wastewater resource recovery facility includes food scrap receiving and preprocessing, followed by codigestion. Photo courtesy of City of Hermitage
Only five out of 62 respondents reported selling the biogas they produced and not using any onsite. The most common use of biogas for WRRFs and farms at the time of survey was to produce both heat and electricity through combined heat and power systems. The second most common use for WRRFs was as fuel for boilers and furnaces to heat the digesters. For stand-alone facilities, the most common use of biogas was as fuel for boilers and furnaces to heat other spaces (i.e., not the digesters). Out of 62 respondents, 84% reported flaring some or all the biogas they produced. Two facilities reported only flaring biogas and not putting any to onsite or offsite use.
Digestate Uses
Digestate is often, but not always, separated into liquid and solid portions, which are then treated and managed separately. The top uses of solid digestate by digester type in the 2024 survey were:
- Stand-alone digesters: Composted into a reusable or salable product, and dewatered or dried then land applied. Other reported uses include turning digestate into animal bedding or cattle feed or selling digestate to help start up other digesters.
- On-farm codigesters: Composted into a reusable or salable product. Other respondents also reported dewatering or drying then land applying the digestates, or land applying in slurry form.
- Codigestion facilities at WRRFs: Dewatered then land applied and landfilled. Other reported uses include land applying as is with no dewatering and composting into a reusable or salable product.
The top uses of liquid digestate by digester type in the 2024 survey were:
- Stand-alone digesters: Discharged to a wastewater treatment plant and reused as fertilizer via land application
- On-farm codigesters: Reused as fertilizer via land application
- Codigestion facilities at WRRFs: Discharged to a wastewater treatment plant (i.e., returned to the beginning of the wastewater treatment system) and recirculated through the digester.
Annual Compilation
Table 2 provides a snapshot of the annual results for amounts of food waste processed and biogas produced as well as survey response rates over the nine years of EPA’s Anaerobic Digestion Data Collection Project (2015-2023).

The number of identified anaerobic digestion facilities processing food waste in the U.S. has increased steadily since the beginning of the Anaerobic Digestion Data Collection Project, from 154 in 2017 to 313 in 2024 (and 313 is likely an undercount). Conversely, the survey response rate has decreased steadily. Each year, the specific facilities that report and the number of facilities that respond to each survey question varies. Therefore, it is not recommended to analyze year-over-year trends in these data.