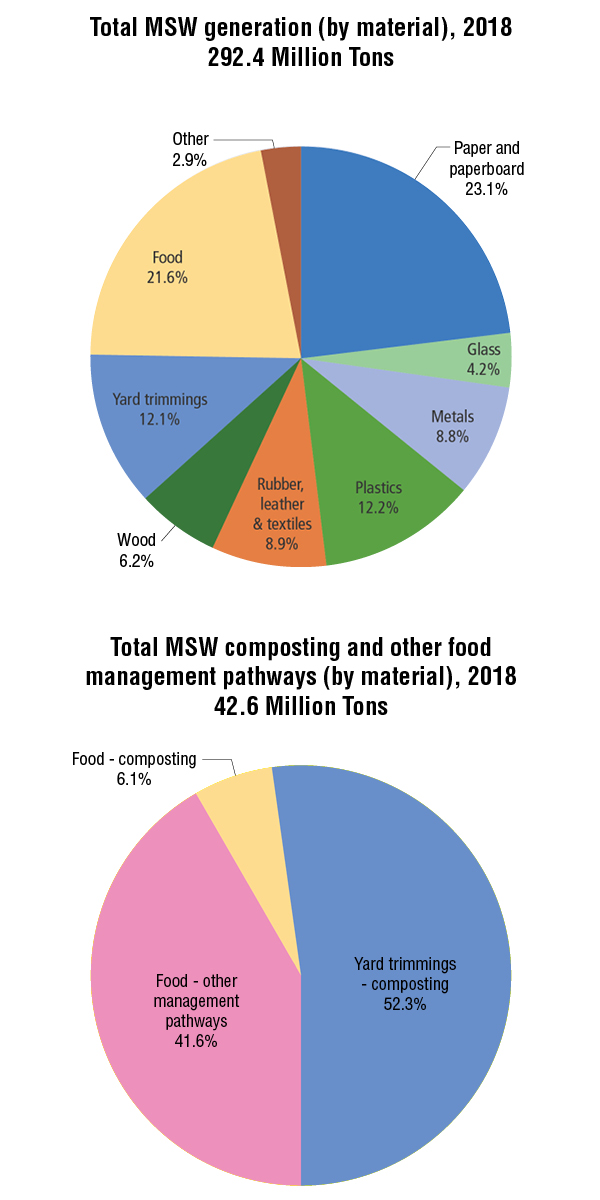
The U.S. EPA released its annual MSW Facts and Figures report in November, based on 2018 data. For the first time, the data includes a category titled “other food management,” defined as animal feed, biobased materials/biochemical processing, codigestion/anaerobic digestion, donation, land application and sewer/wastewater treatment. The quantity of food waste diverted through this category was 17.7 million tons as compared to 2.6 million tons recycled via composting.
 Interestingly, food waste represents the largest category of MSW combusted with energy recovery (21.85% of the total 34.6 million tons combusted); plastics are the next largest category (16.29%). In terms of total MSW landfilled in 2018 (146.2 million tons), food waste comes in first (24.13%), with plastics (18.49%) and paper and paperboard (11.78%) coming in second and third.
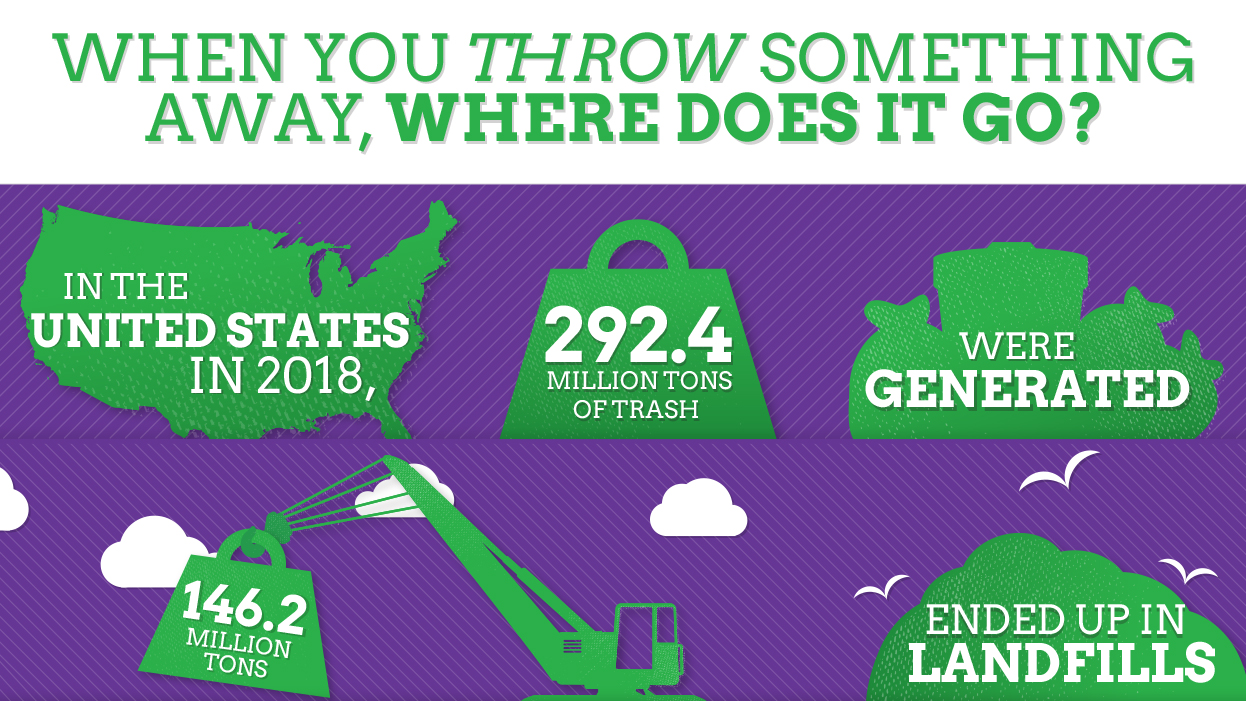
The total generation of municipal solid waste (MSW) in 2018 was 292.4 million tons (U.S. short tons, unless specified) or 4.9 lbs/person/day. Paper and paperboard are the largest category of MSW generated (23.05%), closely followed by food waste (21.59% or 63.1 million tons). Yard trimmings comprised the next largest material category, estimated at 35.4 million tons, or 12.1% of total generation. Of the MSW generated, approximately 69 million tons were recycled and 25 million tons were composted, equivalent to a 32.1% recycling and composting rate. The combustion rate is 11.8%, with the majority of MSW generated in the U.S. — 50% — going to landfill disposal.