This version of the BioCycle Nationwide Survey on Full-Scale Food Waste Composting Infrastructure in the U.S. was updated on September 24, 2023 due to an oversight. The state of Wyoming has one full-scale food waste composting facility, operated by Teton County Integrated Solid Waste & Recycling. The summary data in the survey article has been updated accordingly.
Nora Goldstein, Paula Luu and Stephanie Motta
In winter 2023, BioCycle launched a survey of full-scale food waste composting facilities in the United States. Like in previous reports, BioCycle defines a full-scale facility as a municipal or commercial facility equipped to receive and process organic waste streams arriving by truckload volumes from generators and haulers on a year-round basis. Typically, these facilities are composting more than 2,000 tons/year of all organic waste. This contrasts with “captive” sites that typically compost their own organics and utilize the finished product on-site. There are hundreds, if not several thousand captive composting projects in the U.S. at universities and colleges, K-12 schools, correctional facilities, resorts, health care centers and corporate campuses.
Community composting sites, which do accept food waste from off-site and often distribute the compost in their locale, vary in scale. Very small, decentralized sites typically can’t accommodate truckloads of food waste; smaller-to-medium community composting operations with capacity to accept larger volumes are included in BioCycle’s 2023 food waste composting infrastructure report.
BioCycle received support from the Composting Consortium, a multi-year precompetitive collaboration of Closed Loop Partners, to conduct its national survey of food waste composting infrastructure, along with a second survey project on residential food waste collection access. This four-part series in BioCycle summarizes the key data and findings from this collaborative project (Parts I and II). Parts III and IV will report on findings of separate Composting Consortium projects, which analyzed state regulations for upgrading yard trimmings composting sites to accept food waste, and anaerobic digestion of compostable packaging.
The data reported is primarily from the 2022 calendar year. BioCycle extends a thank you to the composting facilities that participated in our 2023 survey. Their information and insights have been critical to taking the pulse of full-scale food waste composting in the U.S.
Methodology
Survey data collection and analysis has been supported by Stephanie Motta, a recent graduate of Presidio’s MBA Sustainable Solutions program. BioCycle compiled a master list of full-scale composting facilities in the U.S. using data from its 2018 survey, BioCycle editorial archives, and the US Composting Council’s directory of Seal of Testing Assurance certified compost manufacturers that accept food waste. About 230 facilities were identified and subsequently divided into operations with only one facility, and companies that own and/or manage multiple facilities. The individual facilities received an online survey questionnaire. Companies with multiple facilities received spreadsheets to fill out; most of the questions in the online survey were asked in the spreadsheet. After the initial outreach, facilities contacted that are no longer in operation were removed from the Master List. A handful of operating facilities declined to participate.
Ultimately, data was collected from 200 food waste composting facilities. A total of 105 completed the online survey; companies with multiple locations submitted data on 73 facilities. Toward the end of the data collection period (March-May 2023), BioCycle created a mini-survey with 10 questions (key data fields necessary for compiling a national infrastructure picture) to composting sites that had not responded; 22 completed the mini-survey.
BioCycle and Part I co-authors Stephanie Motta and Paula Luu, senior director of Closed Loop Partners’ Center for the Circular Economy, conducted a robust quality assurance review to address inconsistencies and anomalies in the food waste composting infrastructure data set.
Data Overview
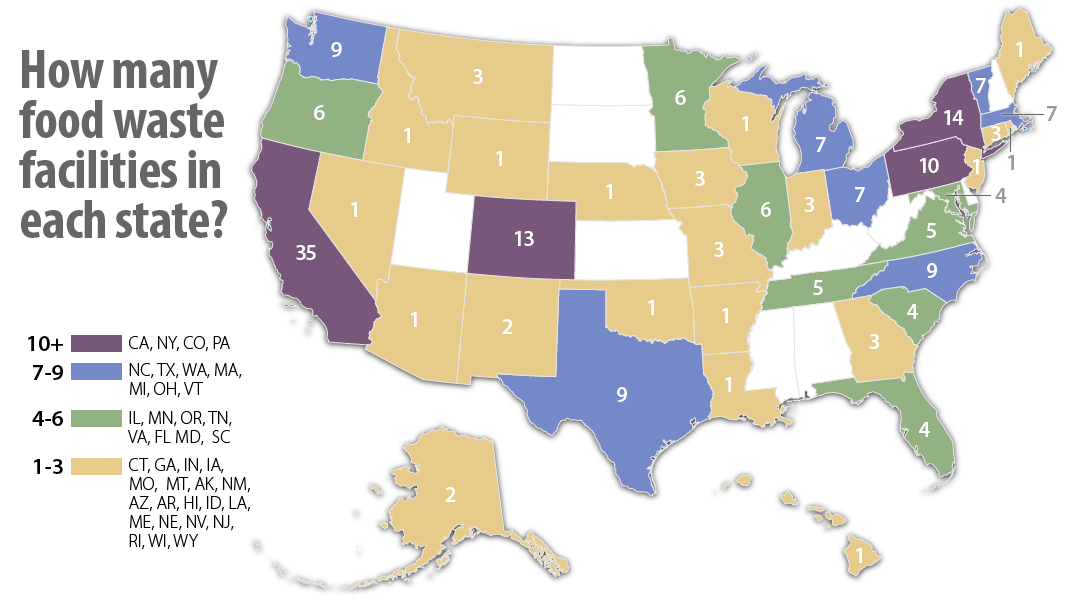
Location: Nearly 50% of all full-scale food waste composting facilities in the U.S. are located in California (35), New York (14), Colorado (13), Pennsylvania (10), Washington (9), Texas (9) and North Carolina (9). Alabama, Delaware, Kansas, Kentucky, Mississippi, New Hampshire, North Dakota, South Dakota, Utah, and West Virginia have been identified as food waste composting deserts, areas without any full-scale composting operations. The feature image (at top) illustrates the geographic distribution of facilities across the U.S. On a regional basis, the West Coast leads in terms of number of full-scale facilities (54, including Hawaii, Alaska and Wyoming), followed by the Northeast (47), Midwest (36), Southeast (30), Mountain states/Southwest (21). and Central states (13).
Year Began: Of the 105 facilities completing the online questionnaire, 40 started composting food waste within the last 10 years and 32 started between 2005 and 2013 (Figure 1). The emergence of community composting sites overlaps with the growth in full-scale facilities since 2013, based on data in the Institute for Local Self-Reliance’s 2022 Community Composters Census.
 Permit Type: Almost 70% (136) of the full-scale operations surveyed have a state solid waste facility permit. About 20% (39) have a source separated organics/food waste tier permit from their state’s solid waste agency. Seventeen report having a registration permit (e.g., below 5,000 cubic yards (cy)/year), and seven have an on-farm composting permit.
Permit Limits on Organic Waste and Food Waste Quantities: Facilities were asked if their permits limited the quantity of total organic waste and separately, food waste, that they are allowed to accept on an annual basis. Of the 159 facilities responding, 66% have an annual throughput limit on the total amount of organic waste they can accept. Of those with permit limits, 44% are at, or close to, their permitted capacity for all organic waste, and 25% have between 50% and 75% available capacity. In terms of limits on the annual tons of food waste that can be accepted, 67% of 162 facilities responding do not have a limit. This may reflect the survey finding that most of the facilities have solid waste permits that may not have limits on annual quantities of food waste accepted. Of the 53 facilities that do have an annual limit on the quantity of food waste they can accept, 65% process less than 10,000 tons/year of food waste.
Feedstocks Accepted
Allowed by Permit to Accept: Composting facilities were asked about the types of feedstocks they are permitted to accept, and the feedstocks they are actually accepting. The question about feedstocks allowed under their permits was only asked on the online survey. Of the 105 responding, the majority are permitted to accept yard trimmings and wood waste (97) as well as all food waste, including meat, fish, and dairy (93). Close to 75% of the 105 respondents are allowed to accept compostable bioplastics and molded fiber containers (78), soiled paper (77), and agricultural waste (71); 65 are permitted to accept animal manure.
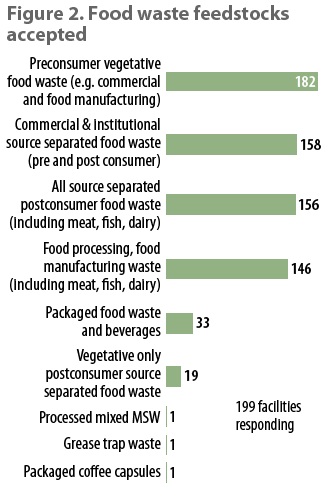 Food Waste Types Accepted: Figure 2 breaks down the types of food waste the facilities are accepting. Over 90% accept preconsumer vegetative food waste (e.g., from supermarkets, restaurants); close to 80% accept commercial and institutional source separated pre and postconsumer food waste. All source separated postconsumer food waste (including meat, fish, and dairy) is accepted by 78% of respondents. Nineteen facilities (<1%) accept vegetative-only postconsumer source separated food waste; one respondent noted they were limited to vegetative only due to the local authority’s concerns about vector attraction. Finally, 73% of facilities accept food processing and/or food manufacturing waste that includes meat, fish, and dairy.
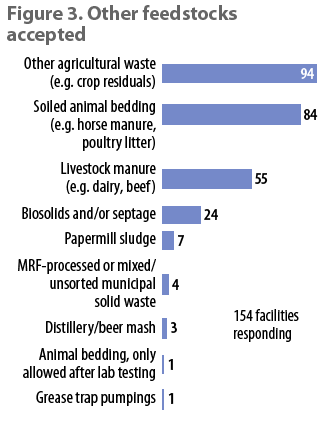 Other Feedstocks Accepted: Figure 3 shows the other types of feedstocks accepted. Agricultural waste (other than livestock manure) represents the largest category (94 of the 154 respondents to this question), closely followed by soiled animal bedding (84), e.g., horse manure and poultry litter. Livestock manure (e.g., dairy, beef) is taken by 55 facilities. Biosolids and/or septage is accepted by 24 sites. Categories of yard trimmings and wood waste accepted were asked in a separate question. Leaves lead the pack (173 of 178 responding to this question), followed by wood chips (166), garden waste (162), brush (156), tree trimmings (156), grass (84), clean wood waste (74), and land clearing debris (58).
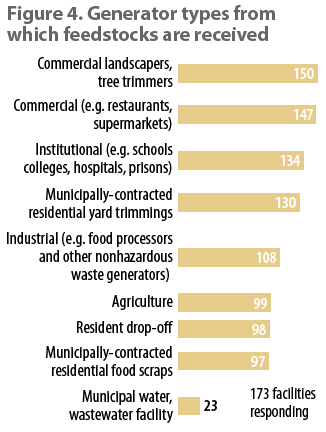 Generators Serviced: Figure 4 captures the categories of generators serviced by the full-scale facilities (173 facilities responding). Commercial landscapers and tree trimmers comprise the largest sector serviced, which makes sense because many of the food waste composting facilities started out composting just yard trimmings along with tree trimmings and wood chips. Commercial food waste generators (e.g., restaurants, supermarkets) come in second (147), followed by institutional generators such as schools, colleges, hospitals, and correctional facilities. The fourth largest category of generators are municipalities (130) that contract with these facilities to process residential yard trimmings. Other food waste generator categories serviced are industrial (108), agriculture (99), residential drop-off (98), and municipally-contracted residential food waste (97).
Acceptance of Food-Contact Compostable Packaging
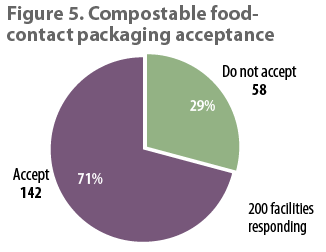 BioCycle has been tracking composting facility acceptance of food-contact certified compostable packaging for more than 15 years. Food-contact packaging is defined as items that either contain food (e.g., carryout containers, snack bags, pizza boxes) or are utilized to capture food waste at the point of generation (e.g., certified compostable liner bags, kraft paper bags). Based on BioCycle’s 2018 data, 60 of the 103 responding to the question indicated they accept compostable food-contact paper products and 49 reported accepting certified compostable food-contact bioplastics products. In 2023, all 200 facilities responded to the question (Figure 5): 142 (71%) accept compostable food-contact packaging and 58 (29%) do not. Additional data collected about food-contact packaging includes:
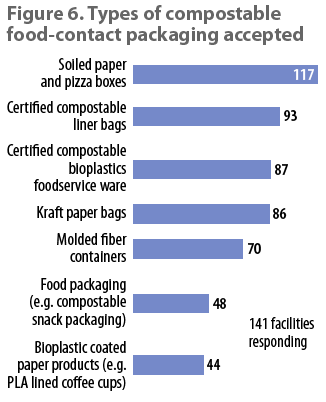 Types: Figure 6 breaks down the types of food-contact compostable packaging accepted (141 facilities reporting). Food-soiled paper and pizza boxes are accepted by 83% (117) of facilities reporting. (A future survey will ask separately about food-soiled paper and pizza boxes to get a more specific assessment regarding paper products/packaging.) Certified compostable bioplastic liner bags are accepted by 93 (66%) of the 141 facilities. These include bags used to line kitchen countertop containers and collection carts. Other types of bioplastics-based packaging accepted by reporting facilities are certified compostable foodservice ware (87) and bioplastics-coated paper products (44). Fiber-based packaging accepted includes kraft paper bags (86) and molded fiber containers (70). Food packaging, such as snack bags, is accepted by 48 facilities.
Reasons for Not Accepting Food-Contact Packaging: Facilities that said they do not accept compostable packaging were asked to select the reasons why using a check-all-that-apply question. There were 55 responses to the question; 78% (43) cited contamination from lookalike single-use plastic packaging and film plastic bags as the main reason. Other reasons given include:
- Compostable bioplastics do not disintegrate in composting process: 32
- Compost sold to certified organic growers (compost that includes bioplastics cannot be used by certified organic growers): 28
- Product labeling insufficient to ensure packaging is certified compostable: 27
- Potential for PFAS contamination in molded fiber products: 26
Compostable Packaging Certification Requirements: Eighty facilities responded to a question about the certification they require for compostable food-contact packaging. Some include more than one certification. The majority (45) require the packaging to be certified by BPI (Biodegradable Products Institute). Other required certifications include ASTM D6400/6868 compostability standard (31); Compost Manufacturing Alliance field-tested (16); and TUV/OK (international certification schemes) (3). Eleven facilities require that the products be tested before acceptance and seven do not require any certification.
Facility Operations
The survey asked a number of questions about the full-scale food waste composting facilities’ operations. The following summarizes the responses:
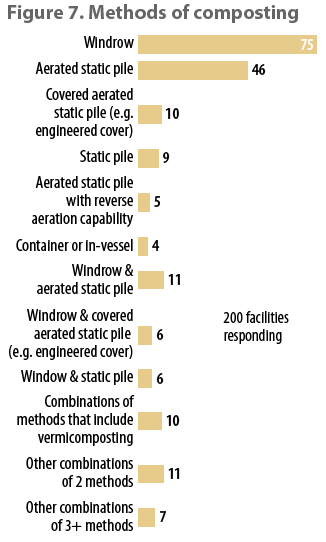 Composting Method(s): Similar to BioCycle’s 2018 food waste composting infrastructure findings, the majority of the 200 facilities responding utilize the windrow composting method (75). As shown in Figure 7, 46 use aerated static piles (ASP), and 11 use both windrows and ASP. Ten facilities have covered ASP (e.g., engineered covers) and nine have static piles. There are four facilities with in-vessel systems. BioCycle has seen an increase in the practice of combining methods of composting at food waste composting facilities. Some start with ASP to better control moisture, odors, and temperatures, and then have turned windrows for maturation, followed by static piles for curing.
Facility Ownership: Of the 200 facilities, 151 are commercially owned, 43 are owned by a municipality (although some are managed by a private company), four are run by nonprofits and two are employee-owned.
Facility Financing: BioCycle asked questions about facility financing in its 2023 survey. Out of a response pool of 126 to a check-all-that apply question, the majority (102) self-financed their facility, 66 received bank loans or financing through an equipment vendor, 36 were awarded state or federal grants, 11 had equity investors and seven received institutional equity and/or debt financing. When asked about the types of financing they may be seeking over the next 12 months (92 responses), 64 selected state and/or federal grants and 52 selected bank loans or financing through an equipment vendor; 15 may seek institutional equity and/or debt financing and 13 might seek an equity investor(s).
Equipment Types: BioCycle received 150 responses to its question about types of equipment used at the composting facilities surveyed. As would be expected, 145 out of the 150 have front-end loaders; 66 utilize windrow turners. Eighty-three facilities report having grinders or shredders, 17 use mechanical mixers, and 14 report having a depackager. In terms of screens, trommels lead the pack (114), followed by vibrating deck screen (39) and star screen (31). Twelve employ hand-sorting lines and 37 have air separation equipment for contaminant removal after screening. One facility reports using “brains and biceps”!
Equipment Upgrades To Accept Food Waste: BioCycle asked facilities about site and/or equipment upgrades that they made if they were adding food waste to an existing yard trimmings composting facility. Of the 121 who responded, 91 indicated the question was not applicable (either implying that no upgrades were necessary or the site began as a food waste composting facility). Twenty-six facilities noted that an improved composting pad and/or working surface were needed (e.g., installing an impermeable pad for food waste receiving or switching from compacted dirt pad to compacted gravel). Twenty-five installed food waste preprocessing/sorting equipment, e.g, a depackager, hand sortation line and/or slow speed shredder. Other upgrades include shifting to a forced aeration composting method (14); procuring a larger loader bucket (11); procuring a windrow turner (9); and installing an air classifier on the compost screen (8). Two facilities procured more land and two built new receiving areas for food waste.
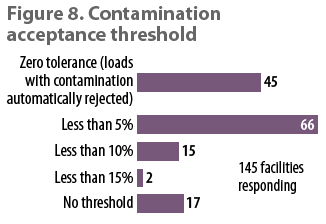 Contamination Management: Figure 8 shows contamination thresholds allowed in incoming feedstocks (145 facilities reporting): zero tolerance (45); less than 5% (66); less than 10% (15); less than 15% (2); and no set threshold (17). A follow-up question on the survey asks how facilities determine if a load meets the threshold (by weight, volume or visual inspection). Of the 106 responses, the majority measure by volume of contamination (76); 15 measure by weight, and 15 do visual inspections.
Facility Expansion Plans: A question about plans for facility expansion received 127 responses: 51 facilities have no plans to expand, 48 plan to expand their existing site, and 28 said they will be opening additional food waste composting facilities.
Food Waste Collection Service: The majority of full-scale food waste composters are not vertically integrated in terms of offering a food waste collection service. Facilities collecting food waste typically will accept loads from other haulers if the feedstock being tipped meets their requirement, e.g., contamination thresholds. Of the 105 facilities reporting, 56% offer food waste collection and 44% do not. When asked if they are interested in expanding into collection (59 responses), 54% said no, 29% said maybe and 17% said yes.
Tonnages Composted
The BioCycle survey asked facilities about the tons of all organic waste and the tons of food waste they compost annually. The response options are given in ranges for two reasons:
- Many facilities, especially smaller ones, do not have scales and thus estimate the volume of material accepted in cubic yards.
- Generally speaking, commercially owned and operated facilities are reluctant to provide exact tonnages but are willing to report when given a range.
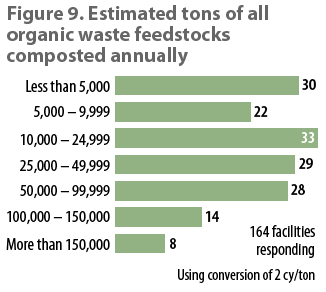 All Organic Waste Received: Figure 9 (164 facilities reporting) shows the tonnages of all organic waste received and composted, including food waste. The response options were given in the tonnage ranges shown in the figure. The conversion factor provided by BioCycle is 2 cubic yards (cy)/ton (although yard trimmings typically are 3 cy/ton). Less than 2% of facilities composted more than 100,000 tons of organic waste in 2022, while 31% composted less than 10,000 tons. Medium-scale operations (>10,000 tons/year to <49,000 tons/year) account for 38% of the facilities reporting. A total of 28 (17%) compost between 50,000 and 99,000 tons/year. Taking the minimum (low end of the range) and maximum (high end of the range) of tonnages of all organic waste the surveyed facilities are composting, we estimate a minimum of 5,165,000 tons/year and a maximum of 8,824,888 tons/year in 2022.
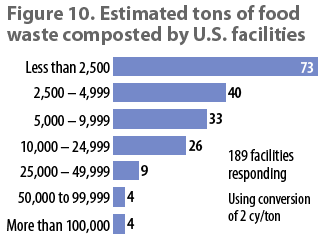 Food Waste Composted: Figure 10 reports the quantity (tons) of food waste composted annually at the full-scale facilities (189 facilities responding). The same 2 cy/ton conversion factor was used. The majority (60%) of full-scale composting facilities in the U.S. responding to this question compost <5,000 tpy of food waste (113). There are 33 facilities composting between 5,000 and 9,000 tons/year (17% of all facilities reporting) and 26 (15%) composting between 10,000 and 25,000 tons/year. Four facilities (0.02%) compost between 50,000 and 100,000 tons/year and four (0.02%) compost more than 100,000 tons/year. When the tons of food waste composted in each range are tallied, we estimate that the full-scale food waste composting infrastructure in the U.S. composted a minimum (low end of the range) of 1,350,000 tons/year and a maximum of 2,652,388/year in 2022.
Figure 11 overlays the reported tons/year of food waste composted with data provided by facilities that reported the permitted tons/year of food waste allowed to be accepted and how much of that allowed capacity is being utilized. As noted earlier, most reporting facilities either don’t have a permitted limit and/or didn’t report capacity. Most of the facilities indicate they have capacity available to receive more food waste.
 Compost Markets
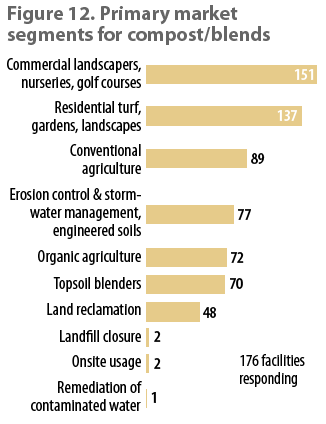 Market Segments: Figure 12 captures the primary compost market segments for the compost and soil blends manufactured (176 facilities reporting). Not surprisingly, commercial landscapers, nurseries, and golf courses are the largest segment where compost and blends are sold (151 reporting), followed by the residential turf, gardens, and landscapes markets (137). These outlets are well established and in fact, since the COVID 19 pandemic, many compost manufacturers have sold out of the compost available. Conventional agriculture (89) and organic agriculture (72) are outlets for many facilities reporting, as are the erosion control and stormwater management, engineered soils markets (77) and topsoil blenders (70).
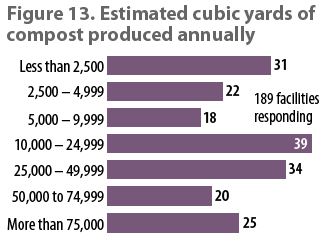 Volumes Produced: The estimated volume of compost produced annually was also reported in ranges. Figure 13 captures this data. Of the 189 facilities reporting, 39 produce between 10,000 and 25,000 cy/year, and 34 fall into the 25,000 to 50,000 cy/year range. There are 31 facilities that produce less than 2,500 cy/year — a reflection of the number of smaller scale facilities responding.
Reflections on Food Waste Composting Infrastructure In The U.S.
Gathering and analyzing data about full-scale food waste composting infrastructure in the U.S. for the past six months have led to a variety of insights about this sector of the organics recycling industry. Our reflections include:
- Since the last BioCycle national survey of full-scale food waste composting facilities in 2018, there has been a pandemic, an increase in states adopting food waste disposal bans or mandates, and media-worthy investment and merger and acquisition activity across the country. Five years later, the number of full-scale food waste facilities has increased 8%, from 185 to 200 facilities — a small but notable change. During that period, there was marked growth in the number of community and captive composting sites. A main takeaway from this year’s data is that food waste composting in the U.S. is happening across the ‘scale spectrum’ — from micro to macro.
- Similar to BioCycle’s findings in 2018, the majority of facilities (60%) reporting compost less than 5,000 tons/year of food waste. Using the maximum tons of food waste composted based on our 2023 data (2.6 million tons), today’s composting infrastructure processes up to 4% of the 66 million tons of total food waste generated annually in the U.S (Source: U.S. EPA). This reflects several realities, including increasing tonnages of food waste (primarily preconsumer) being processed at anaerobic digestion facilities, reluctance on the part of yard trimmings composting operations to accept food waste due to concerns about odors and contamination from conventional plastics, and facilities in a lower permitting tier that are limited on the annual tons of food waste they can accept. The composting industry is at an inflection point in its development, and to meaningfully address food waste, the industry needs to spur investment and industry action to establish compost manufacturing as a viable solution for food waste at scale.
- In terms of the quantities of all organic waste composted, ‘mega’ facilities are few and far between. Smaller-scale, independent operations play an important role in establishing food waste processing across the country. Funding for both ‘mega’ facilities and smaller scale facilities are needed to scale the industry’s capacity to process food waste as a whole. This is inclusive of ‘captive’ composting facilities which are on-site and do not accept off-site feedstocks.
- The majority of facilities that accept food waste today take compostable packaging of some sort (71%), and this trend is growing compared to historical data (up from 58% in BioCycle’s 2018 survey). The number of facilities that accept certified compostable food-contact bioplastics packaging (e.g., foodservice ware) also increased over the past five years — 87 out of 141 (62%) in 2023 as compared to 49 out of 103 (48%) in 2018. This increase reflects the progress made by certification bodies (i.e., BPI) and field-testing services (i.e., Compost Manufacturing Alliance) that instill a growing trust in products entering the market.
- Like past years, there is a reluctance among commercially operated facilities to share data, especially on the part of large solid waste companies that are increasingly operating full-scale food waste composting sites. That reluctance, combined with the unavailability of some data requested, makes it somewhat challenging to paint a national picture. Legislation currently in Congress, the bipartisan, bicameral Recycling and Composting Accountability Act, requires the U.S. Environmental Protection Agency (EPA) to collect and publish data on recycling and composting rates across the country to provide an accurate reflection of performance both nationwide and at the state level. This legislation will be an immense help to data on the composting sector.
In summary, food waste composting infrastructure in the U.S. is a proposition of different scales. BioCycle foresees that diversity and distribution of composting infrastructure continuing to grow. Part II of this series will report on the findings of BioCycle’s 2023 Residential Food Waste Collection Access Study, also conducted in collaboration with Closed Loop Partners’ Composting Consortium. Food waste composting facilities participating in the BioCycle’s 2023 Nationwide Survey: Full-Scale Food Waste Composting Infrastructure in the U.S. is available at this link.
Nora Goldstein is Editor of BioCycle, and has been conducting surveys on food waste composting infrastructure in the U.S. since the mid-1990s. Paula Luu is a Senior Project Director at Closed Loop Partners, an impact investment firm and innovation center focused on development of the circular economy. She leads the firm’s Composting Consortium, which works closely with brands, composters and other key stakeholders to gather data that can inform the best path forward and drive value across the composting system. Stephanie Motta is a Data Strategist for Closed Loop Partners’ Composting Consortium. Additionally, she leverages her recent MBA by actively contributing her expertise as a sustainable business consultant, empowering organizations towards ESG-focused practices.


