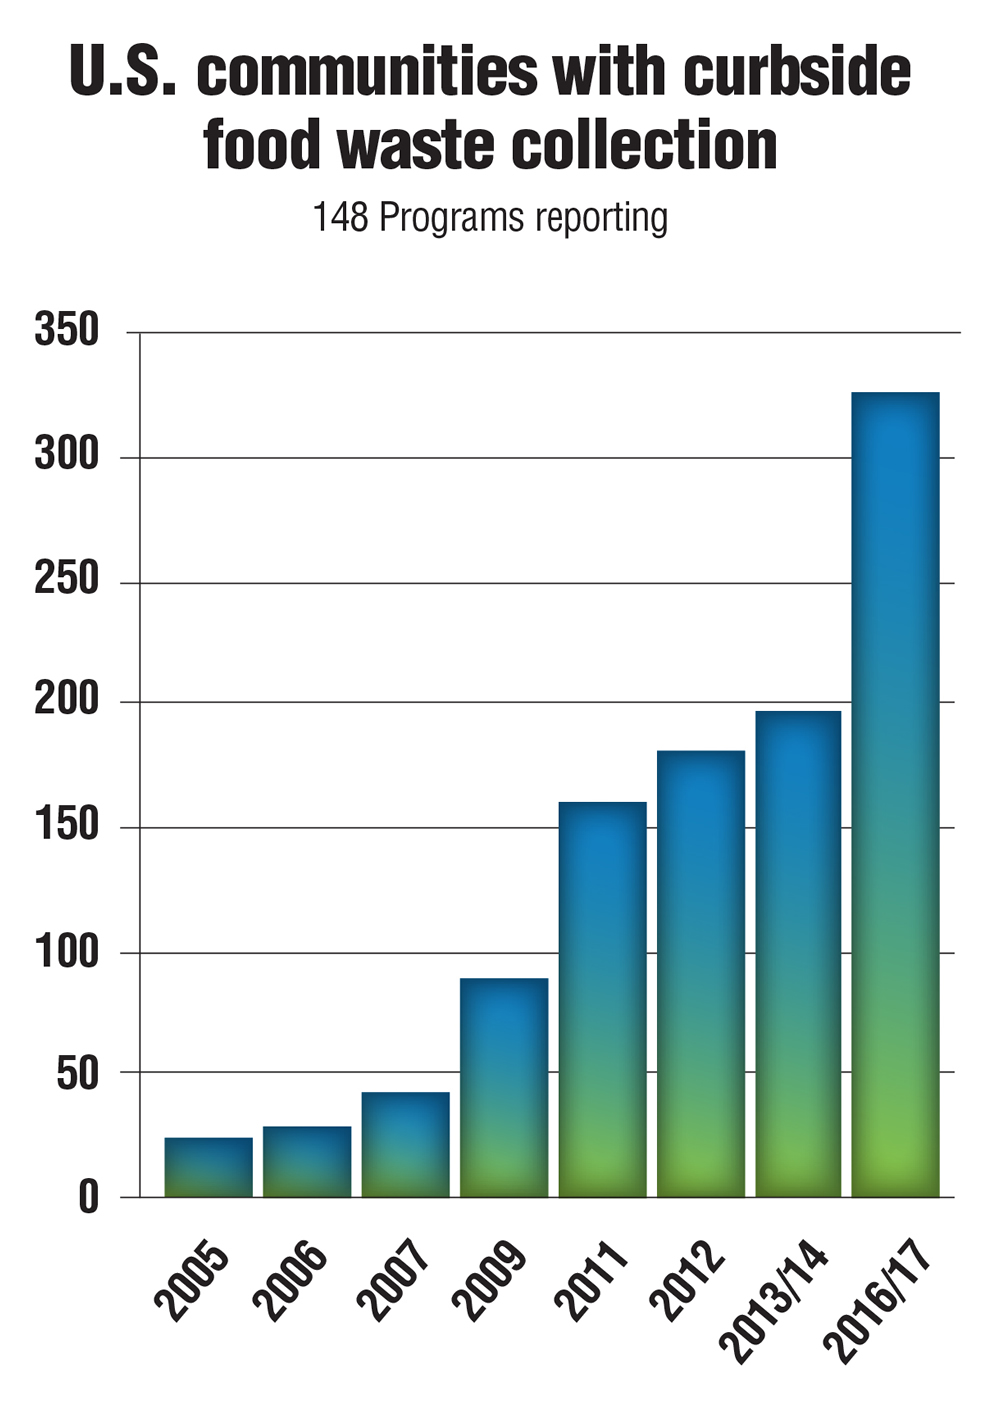
Survey of residential food waste collection programs across the country from June to November 2017 ultimately identified 148 curbside collection and 67 drop-off programs.
Virginia Streeter and Brenda Platt
BioCycle December 2017
BioCycle and the Institute for Local Self-Reliance (ILSR) undertook a survey of residential food waste collection programs across the U.S. from June to November of this year. BioCycle contracted with ILSR to conduct the 2017 BioCycle Residential Food Waste Collection Access Study, which was last updated in 2014 (see “Residential Food Waste Collection In The U.S.,” January 2015). This year’s study — the eighth since BioCycle began the national survey in 2005 — includes residential food waste drop-off programs for the first time.
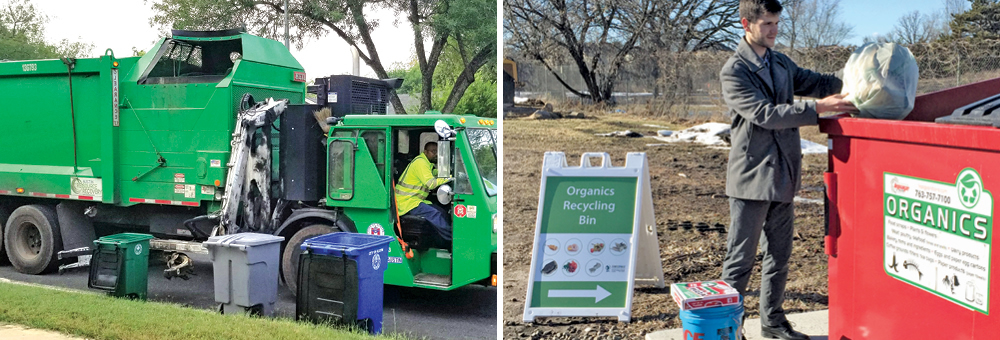
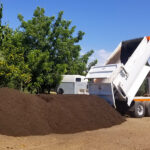
Austin, TX, the newest program included in this year’s survey, just rolled out curbside service to 52,000 households at the beginning of October, and plans to expand to all households by 2020 (left). Anoka County, MN has two year-round drop-off locations at county yard trimmings sites. Each site has separate drop-off containers for food waste/soiled paper/compostable plastics, yard trimmings and tree waste (right).
 The 2017 survey is utilizing the term “access,” defined as number of households able to participate in a given program, regardless of actual participation. Therefore the number of households with access does not necessarily equal the number of households partaking in the service — not all households in service areas will choose to participate.
The 2017 BioCycle Residential Food Waste Collection Access Study only includes programs that are actively offered or supported by local government. It does not cover private haulers offering subscription service for residential food waste collection independent of the government’s involvement. A number of private collection programs offer residential services, providing another means of access to numerous communities, but these programs are outside the scope of this study.
This article is a Preview of the full report, available as a PDF that can be downloaded at BioCycle.net by BioCycle readers with a paid subscription. The full report includes tables listing all the curbside and drop-off programs in the U.S., numerous charts and graphs illustrating survey data, and an analysis by ILSR and BioCycle. We thank all the residential food waste collection program managers, state 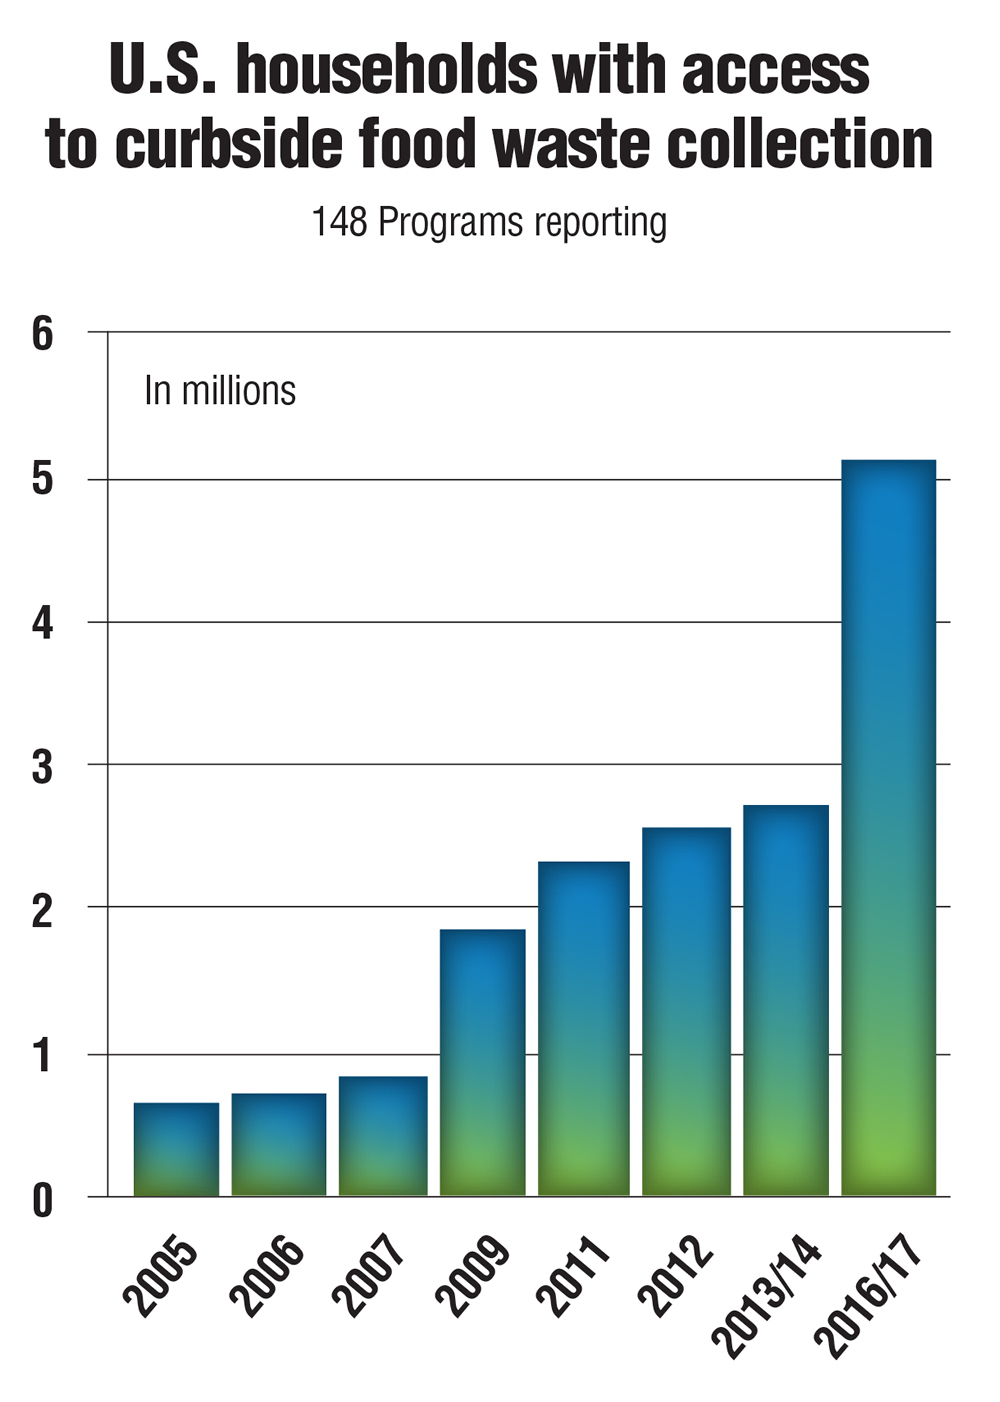 organics recycling agencies and many others for their participation in the 2017 BioCycle Residential Food Waste Collection Access Study. BioCycle also thanks the Foodservice Packaging Institute and the Biodegradable Products Institute for their underwriting of this study.
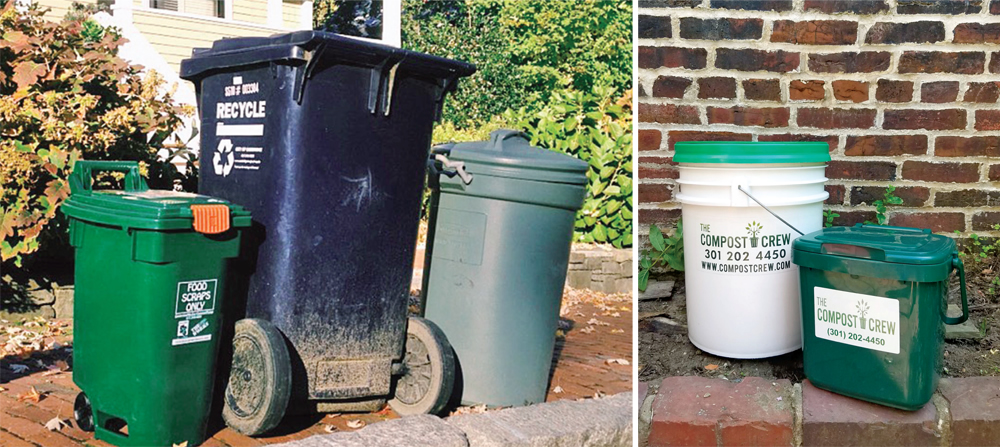
Cambridge, MA (right) is in the midst of expanding curbside collection access from 5,000 to 25,000 households. Falls Church, VA (far right) started a curbside program in June, operated by Compost Crew, a local hauler. The city was able to keep costs low through an innovative cost-sharing program.
The Big Picture — Curbside
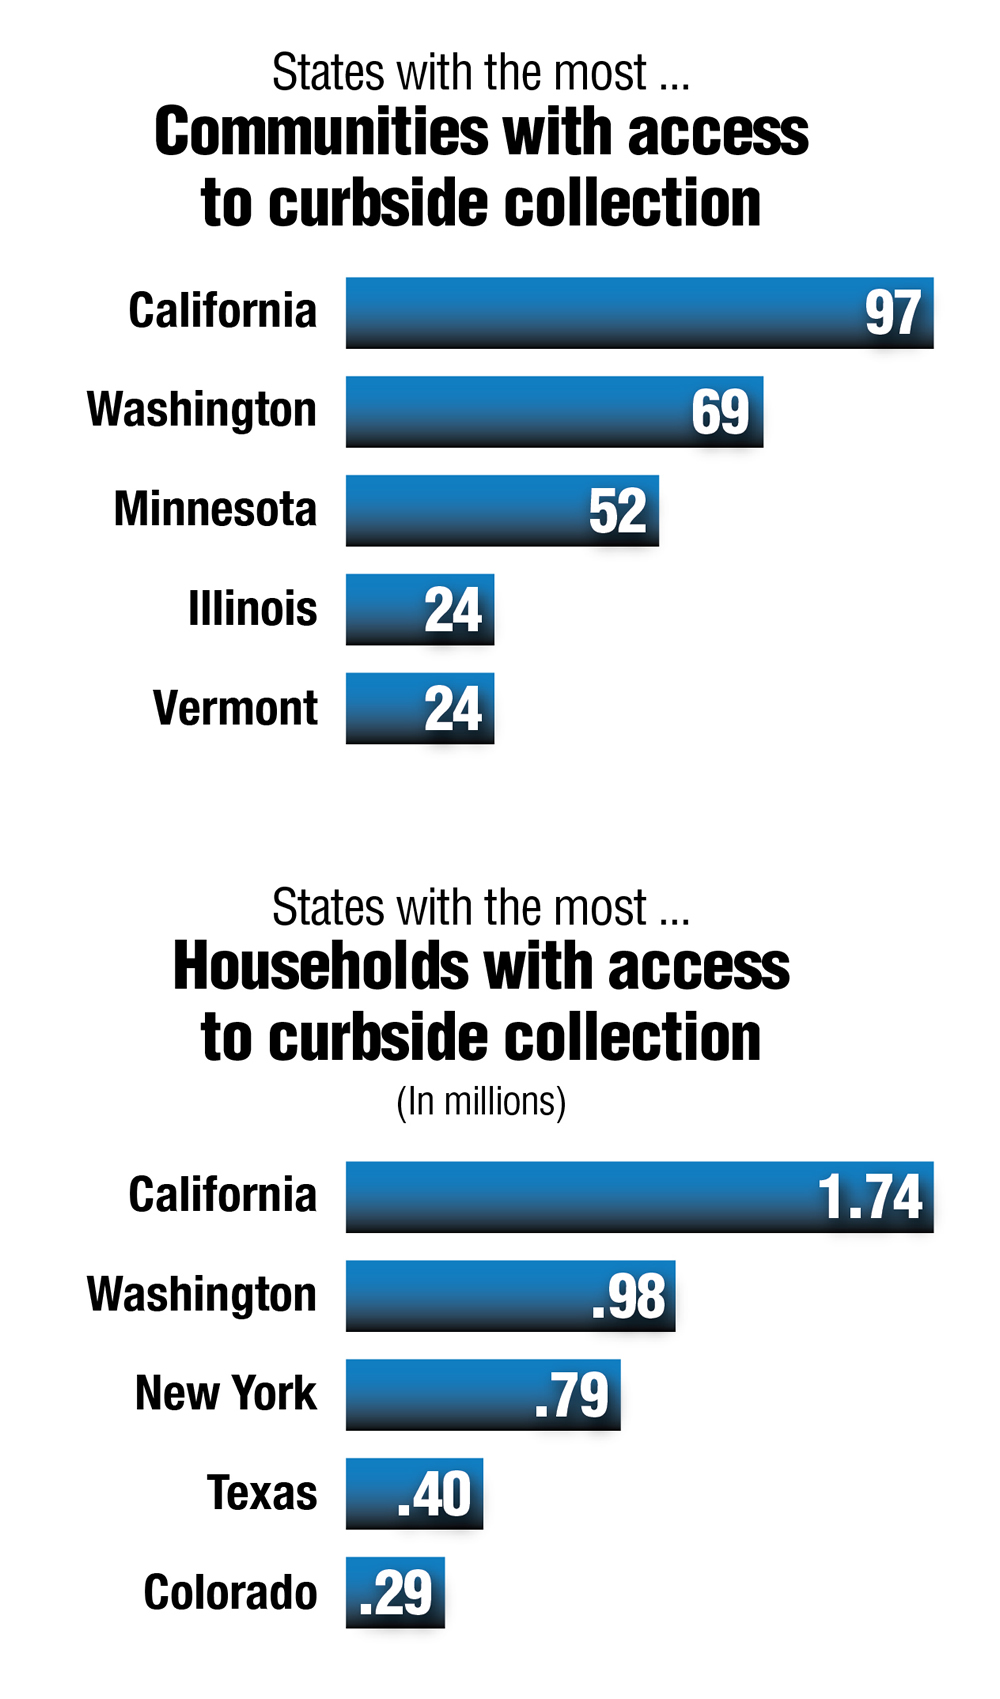
The number of curbside collection programs has increased from 79 in 2014 to 148 in 2017, or 87 percent (Table 1). As many programs are administered by counties or solid waste districts, not individual cities, the number of communities being serviced is also counted. This year, households in 326 communities have access to food waste collection, up from 198 at the time of the last study (a 65% increase). There are curbside programs in 20 states; three of those states added programs since 2014, and thus are totally new to this study. Finally, 5.1 million households have access to curbside collection, a growth of 2.4 million since the last study (Table 1).
Scale and Type of Curbside
Curbside programs are classified as either standard offering, opt-in, or mandatory. Of 77 programs reporting data for this question, 47 are “standard,” meaning organics collection is offered alongside trash and recycling, with no extra steps needed for residents to participate. “Opt-in” programs, which represent 21 of the 77, require residents to sign up to receive food waste collection service. Often, these programs are serving only a small portion of households with access. For example, in Bellingham, Washington, 19,000 households have access to curbside collection, but only 5,000 have signed up to participate. Finally, there are the mandatory programs, where all residents must participate. There are eight mandatory programs, half of which are in California. A summary table in the full study report identifies these 77 programs and the type of service.
Programs are also classified by their scale of service — either pilot, partial, full-scale single-family dwellings, or full-scale all. Out of the 73 programs reporting this data, 11 are pilots, serving a relatively small number of households. Seven programs are partially rolled out, with plans to expand service. The majority of programs are full-scale single-family dwellings, meaning all single-family households receive service. (This may include small multifamily dwellings in cities that provide trash service.) Full-scale “all” means every single household has access to service, including multifamily dwellings. Only 11 programs have reached this scale of service.
 Curbside Materials Accepted
This year, the access study delved further into what materials each program accepts. All 148 programs take fruit and vegetable scraps, and over 90 percent of programs accept meat, fish and dairy. After that, however, there is quite a lot of variation. The majority of programs take paper bags and uncoated food-soiled paper. Less than half of programs are accepting compostable plastic products, such as compostable plastic bags, compostable plastic-coated paper products, and compostable plastic packaging and foodservice items. Molded fiber containers and food-soiled paper coated with conventional plastics round out the bottom of the list, with less than a quarter of programs accepting the fiber containers, and about 7 percent taking conventional plastic-coated paper.
Curbside Program Success
Fifty-four out of 71 survey respondents reporting for their programs consider their program successful. Fifty of those provided reasons for success. Meeting diversion goals was by far the most prevalent reason (41 of 50), followed by cost effectiveness (26 of 50) and avoided disposal costs (25 of 50). Only five out of 71 consider their program unsuccessful.
Twelve of 71 survey respondents reporting for their programs weren’t sure whether their programs are successful. Most commonly, this was due to the newness of the program. Five of the programs are still in the pilot phase, and four had just started or were still in the process of rolling out at the time of the survey. The other three programs deemed they did not have the necessary tools to measure success.
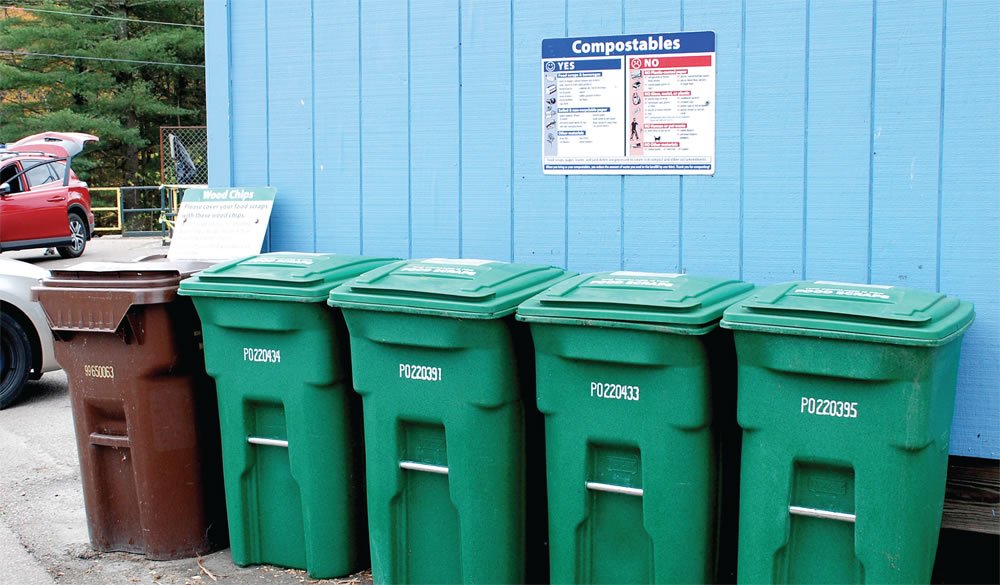
Chittenden County, VT has operated a drop-off program for 16 years. Currently, eight sites are open to residents year round.
The Big Picture: Drop-Off
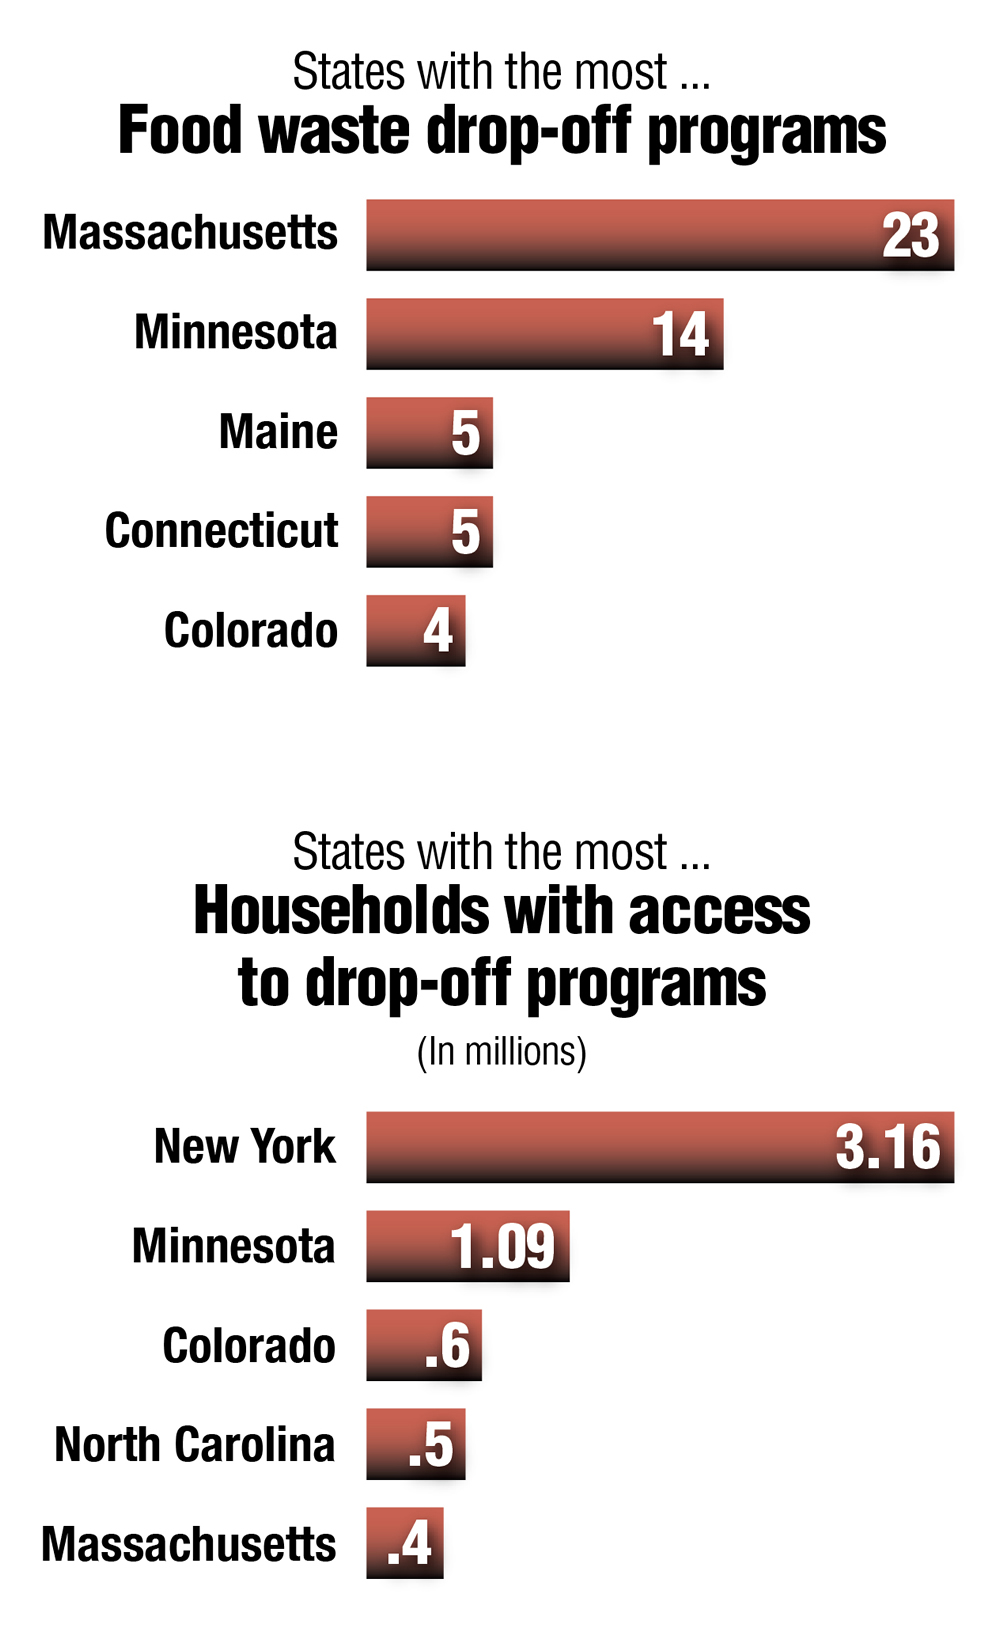
As noted, the 2017 BioCycle Residential Food Waste Collection Access Study includes data on drop-off programs — a growing phenomenon — for the first time. While no historic data is available for comparison, according to survey participants, 26 of 49 drop-off programs reporting this data have started in the past three years. In total, 67 drop-off programs are included in 15 states — five of which have no curbside programs, demonstrating the value of drop-off programs in introducing food waste collection to new areas (Table 2). These drop-off programs serve 318 communities; 6.7 million households have access. (Note: Due to New York City’s extensive drop-off program, all residents are considered to have access, meaning that NYC accounts for 3.9 million households of the 6.7 million.)
 Types Of Drop-Off
The types of drop-off programs are varied, from round-the-clock access to weekly availability at farmers markets. Some are located at transfer stations or recycling depots, where residents can bring their food scraps along with household recyclables. New York City has been operating drop-off sites at more than 50 farmers markets for a number of years. More recently, drop-off locations were opened at subway stations, public libraries and other heavily trafficked areas.
Drop-off Materials Accepted
Like the curbside programs, all drop-off programs accept fruit and vegetable scraps, and the vast majority also take meat, fish and dairy. Other feedstocks that the majority accept include uncoated food-soiled paper, paper bags, and compostable plastic bags. The remaining materials are all accepted by less than half of programs, including yard trimmings and compostable plastic items other than bags. Once again, molded fiber containers and food-soiled paper coated with conventional plastics are the least accepted feedstocks. Around a quarter of all programs allow molded fiber containers, and only 6 percent include the plastic-coated paper.
Success Of Drop-Off
Of 30 survey respondents reporting on the success of their programs, not a single one considers their program to be unsuccessful. Twenty-five of the 30 programs were labelled a success. Among those 25, the most commonly cited reasons were meeting diversion goals and avoided disposal costs, which were also two of the top three reasons seen in curbside programs. Interestingly, only two of the 25 programs considered participation rates as a reason for success.
Full Report
The full report on the 2017 BioCycle Residential Food Waste Collection Access Study includes individual program information, along with data on types and sizes of curbside containers, collection service providers, types of drop-off programs, drop-off site staffing, which programs collect food waste with yard trimmings, and more.
Brenda Platt directs the Composting for Community Project at the Institute for Local Self-Reliance and is the lead author of the State of Composting in the U.S.: What, Why, Where & How. Virginia Streeter is a Research Associate for ILSR’s Composting for Community Project.