
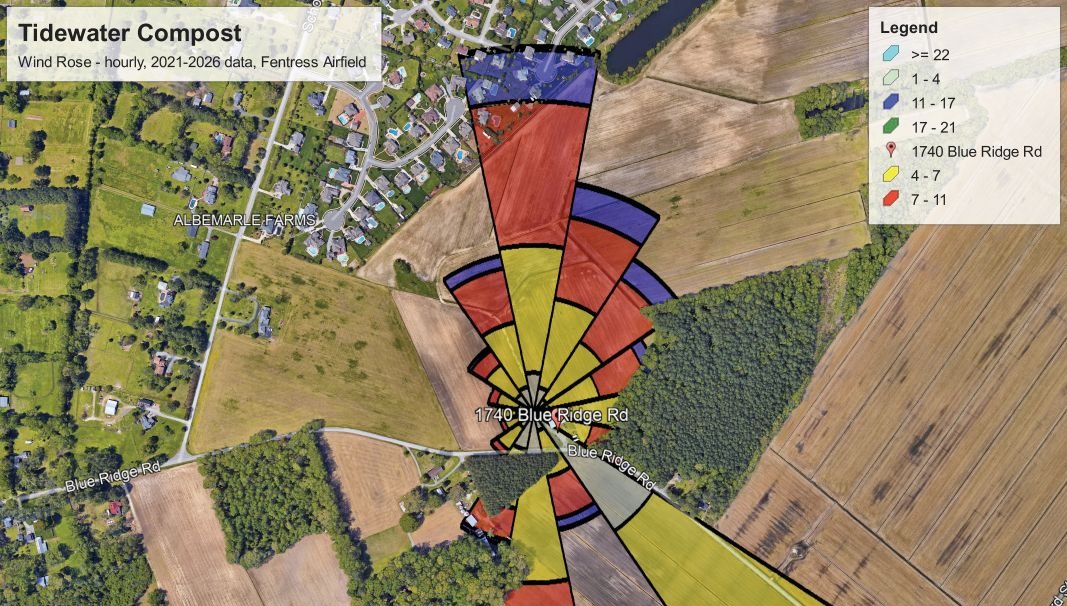
Top: Wind rose for Tidewater Compost courtesy of Craig Coker and Cameron Kania.
Craig Coker and Cameron Kania
Few of us object to the feeling of a gentle breeze on a sunny warm day but the wind can be both a bane and a benefit to composters as it both transports and disperses air pollutants.
What is Wind?
The root cause of wind is the sun unevenly warming the Earth. Wind is created in the atmosphere by differences in atmospheric pressure, where air moves from areas of higher pressure to areas of lower pressure. When the sun heats a patch of land or water, the air above it warms up. As it warms, the air molecules spread out, making it less dense. This lighter, warmer air rises into the atmosphere, leaving a “void” or low-pressure zone at the surface. In cooler regions (like over the oceans at day or near the poles), the air is cold. Cold air molecules slow down and pack more tightly together, making the air denser and heavier. This heavier air sinks toward the ground, creating a high-pressure zone.
Nature always seeks balance, so to equalize this imbalance, the denser air from the high-pressure area rushes sideways to fill the space left by the rising air in the lower-pressure area. This horizontal rush of air is wind. The greater the difference in pressure between the two regions, the faster the wind blows. This is one reason for the powerful winds of tropical storms and hurricanes; the pressure gradient between the ultra-low pressure core of the storm and the higher-pressure areas outside the storm’s influence is very steep.
Site planning for new composting facilities is one of the more challenging aspects of infrastructure development. Among the many factors to be considered, wind speed and direction are very important. Wind can both transport and dilute air pollutants from organics recycling, such as volatile organic compounds off-gassed by processing, or bioaerosols (microorganisms, plant matter [think pollen] and animal matter [think dried bird droppings]) kicked up into the air by materials handling and screening.
Knowing the characteristics of the wind at a potential site helps with understanding where sensitive receptors might be located, how to lay out the facility design and operation to minimize off-site transport of pollutants, and how to design mitigating measures like berms and screenings. You can characterize the wind at a particular site by constructing a wind rose.
What is a Wind Rose?
A wind rose is a graphic tool used to show how wind speed and direction are typically distributed at a site. It serves as visual shorthand for a massive amount of meteorological observation data collected over long periods of time. It allows you to understand “the prevailing wind direction(s)” at a site. Three primary steps are involved, as explained below: Data download, data clean up, and putting the data into the creation software program.
Data Download
To build a wind rose, start with lots of data. Hourly observations of wind speed and direction are made at thousands of airports around the world every day. In the U.S., you can obtain this data from the Climate Data Online Search engine at the National Center for Environmental Information (NCEI) at the National Oceanic and Atmospheric Administration (NOAA). In the drop-down boxes, select “Local Climatological Data” for Weather Observation Type. Select the date range you want (you should use at least five years’ worth of continuous data). In the Search For drop-down box, you can select almost any geographical descriptor, but selecting “Station” will drill down into the database and save you time. You’ll need to know the name of the nearest airport to enter into the search bar.
If the site you are evaluating is in hilly or mountainous terrain, wind direction and speed will be affected by topography (hills and valleys) but you can still get a good regional perspective from nearby airport (less than 20 miles) weather data. To learn about the micrometeorology of a particular site, you can do multiple personal observations over time or set up (with the owner’s permission) a small weather station to take on-site readings. There are several high-quality, inexpensive sources for remote weather stations that can use cloud-based systems to record site weather data.
The NCEI website will take you to a map with key stations identified in the search results, along with their periods of record for the data. Click on “Add to Cart” to obtain all the meteorological observation data for that station in that time range. This data is free so click on the cart icon and it will take you to Select Cart Options, where you can specify the format you want (you’ll want the .CSV file option). After selecting the file format option, reconfirm the date range you want for the data. Enter your email address in the checkout window and look for an email notifying you that your order has been submitted. There will be a hyperlink in the second email where you can download the data. Right-click to select “Download Linked File As” and save the .CSV file to an appropriate location on your computer. You will see a vast amount of data, with 24 hourly observations per day, 365 days per year in 175 meteorological categories (not all cells will have data in them).
Data Cleanup
Data cleanup is next so get a fresh cup of coffee and start winnowing out the data you will not need for the wind rose creation software. Start by making a copy of the downloaded file so you don’t modify the original data download. Keep Station Number, Date, Hourly Wind Direction and Hourly Wind Speed columns. You can delete the rest. You may need to break out the data in the Date column into separate columns for Year, Month, Day, Hour (this is how the wind rose software needs the input formatted). You should also delete any recorded duplicates and remove any rows that do not have both speed and direction data. In the example discussed below, the cleaned up dataset had seven (7) columns and 63,455 rows for the five years’ worth of data we modeled. Convert the cleaned file to a Microsoft Excel workbook for uploading into the wind rose software.
Creation Software
The wind rose creation software is a freeware product called WRPLOT View, available from Lakes Environmental Software. The software will only run on a PC, not a Mac. The home screen of the model, showing the data we uploaded is in Figure 1.
Figure 1. WRPLOT Viewer Home Screen

Click image to enlarge.
Tidewater Compost Site Plan
Tidewater Compost is a concierge food scraps collection company planning a new composting facility in a city in eastern Virginia. It commissioned Coker Composting and Consulting to create a wind rose analysis utilizing historical meteorological data collected from the Naval Auxiliary Landing Field Fentress, located in close proximity to the project site. The purpose of this analysis was to evaluate prevailing wind patterns, wind frequencies, and typical wind speeds in order to support the development of a site plan and an operations manual that recognizes these weather patterns.
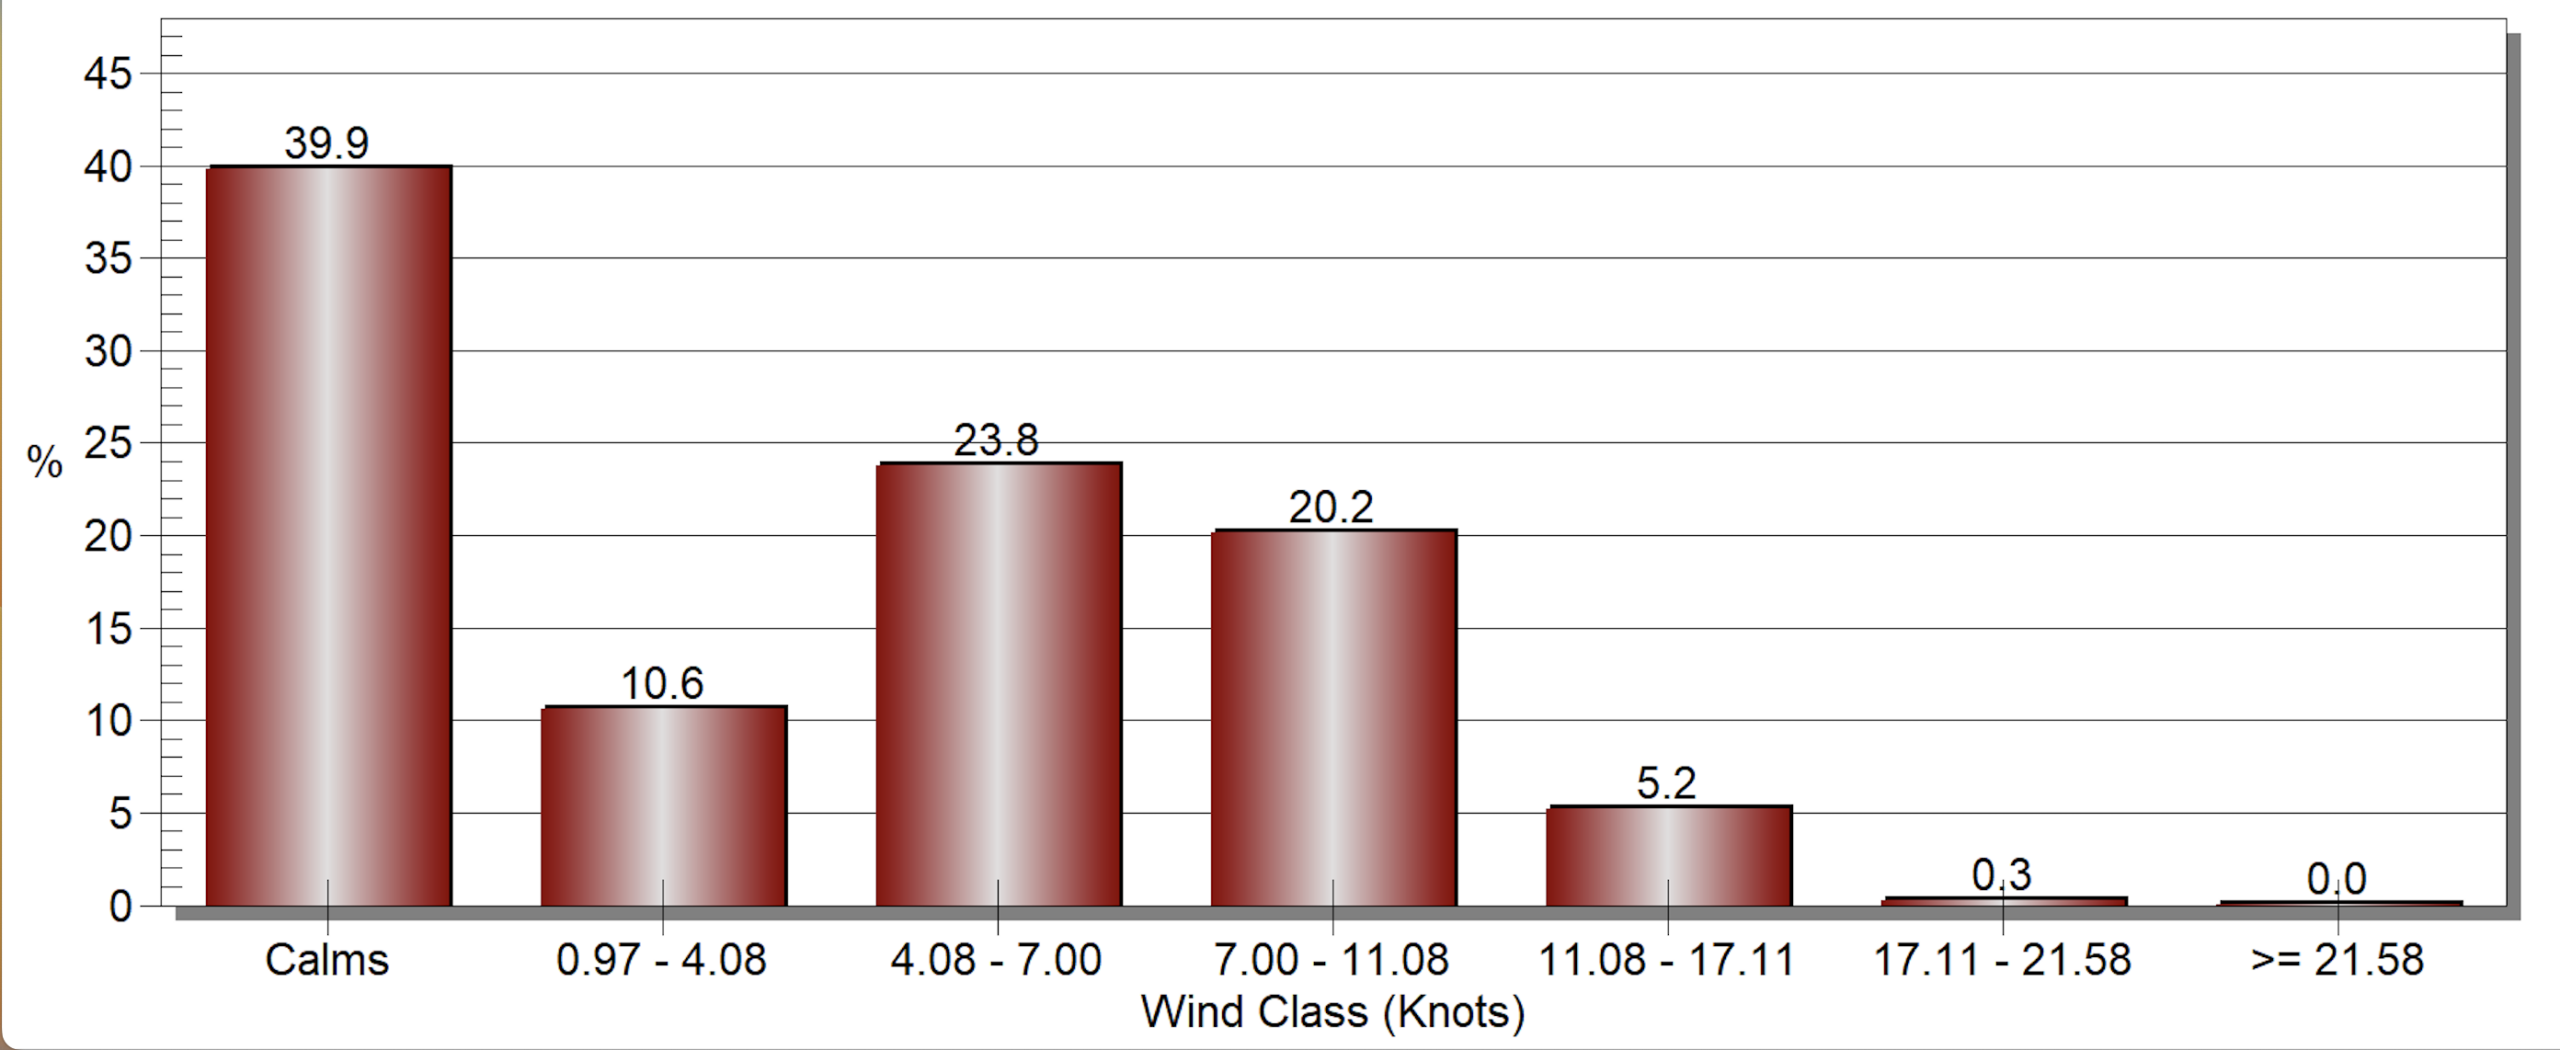
This data is pictured graphically in Figures 2 and 3. In Figure 2, the wind rose from WRPLOT was converted to an image file and overlaid on an aerial photo of the site in Google Earth. The WRPLOT model also gave us a graphic of wind class frequency distribution (Figure 3). The analysis demonstrated:
- Calm winds 39.9% of the time (0-1 mph)
- Very light-to-light wind conditions 54.6% of the time (1-13 mph)
- Moderate wind conditions 5.2% of the time (13-20 mph)
- Very limited sustained high-wind events 0.3% of the time (21-25 mph)
- Distributed wind directions (primarily out of the southeast)
- Low potential for sustained long-distance particulate transport
The overwhelming majority of recorded wind activity occurs within the:
- 1-4 knot range (1-5 mph)
- 4-7 knot range (5-8 mph)
- 7-11 knot range (8-13 mph)
This data supported Tidewater’s request for an alternative screening plan which is designed to achieve the intent of the City’s buffering requirements through a combination of constructed berming, native vegetative windbreaks, structural screening, substantial setbacks, existing site features, and operational safeguards. The City’s zoning ordinance requires a minimum 1,500-foot setback from any residential structures and requires a vegetative screen that is 50-feet wide, and planted with four trees and 75 shrubs per 100 linear feet of screen.
Figure 2: Tidewater Compost Wind Rose

Click image to enlarge.
Tidewater Compost proposed installation of a 4- to 5-foot constructed berm and native vegetative windbreak along the frontage of the composting operation on the southeast side of the property (the eastern side is already densely wooded).
Countering the City’s prescriptive density-based planting requirement, the proposed design focuses on measurable performance outcomes including visual screening, wind attenuation, particulate interception, odor dispersion, and compatibility with surrounding agricultural and residential land uses.
Figure 3. Wind Class Frequency Distribution
Click image to enlarge.
Figure 4 presents the proposed site screening and landscaping plan, illustrating the overall relationship between the composting operational area, existing pole barn, frontage berm, native windbreak plantings, western privacy fence, adjacent road frontage, and nearby receptors.
Figure 4. Proposed Site Plan

Click image to enlarge.
Figure 5 provides a conceptual cross-section of the proposed berm and native windbreak system. The cross-section illustrates the layered design approach, including the roadside ditch, 4- to 5-foot berm, native shrub and tree plantings, airflow redirection, setback distance, and the location of composting activities beneath the existing pole barn. The illustration is intended to demonstrate how the proposed system functions as an integrated environmental control feature that combines topographic screening, vegetation, structural shielding, and operational setbacks to reduce visibility, intercept particulates (and odor molecules adhered to particulate matter), improve airflow management, and support compatibility with surrounding land uses.
Figure 5. Tidewater Compost Proposed Windbreak

Click image to enlarge.
Primarily Calm Winds
Operationally, what Tidewater Compost learned from the wind rose model is that calm or low-speed winds occur nearly 50% of the time. This means the operators will have to keep one eye on the weather, as a combination of low wind speeds (generally less than 4 miles per hour) coupled with a narrow spread between ambient and dew point temperatures will cause the heavier-than-air odors to hug the ground and follow topographic valleys downwind (in this case, away from the houses to the northwest). In the eastern U.S., these types of meteorological conditions occur often on cool mornings before the sun has heated the atmosphere and caused wind movement.
Operationally, what this means is that waste handling activities, for example like unloading feedstocks, requires covering the load with wood chips or compost immediately upon arrival, and, considering whether to turn windrows until weather conditions improve and/or refrain from screening unfinished immature compost. These are all prudent operational steps to follow to minimize potential for an off-site odor episode.
Analyzing the wind and how it might affect composting site layout, design and operation is an integral part of facility planning.
Craig Coker is CEO of Coker Composting and Consulting, a Senior Editor at BioCycle and part-owner of Star City Compost in Roanoke VA. He can be reached at ccoker@cokercompost.com. Cameron Kania is CEO of Tidewater Compost in Virginia Beach VA. He can be reached at info@tidewatercompost.com.